Gene Page: COG7
Summary ?
| GeneID | 91949 |
| Symbol | COG7 |
| Synonyms | CDG2E |
| Description | component of oligomeric golgi complex 7 |
| Reference | MIM:606978|HGNC:HGNC:18622|Ensembl:ENSG00000168434|HPRD:07373|Vega:OTTHUMG00000094807 |
| Gene type | protein-coding |
| Map location | 16p12.2 |
| Pascal p-value | 0.088 |
| Fetal beta | -0.188 |
| DMG | 1 (# studies) |
| Support | CompositeSet |
Gene in Data Sources
| Gene set name | Method of gene set | Description | Info |
|---|---|---|---|
| CV:PGCnp | Genome-wide Association Study | GWAS | |
| DMG:Wockner_2014 | Genome-wide DNA methylation analysis | This dataset includes 4641 differentially methylated probes corresponding to 2929 unique genes between schizophrenia patients (n=24) and controls (n=24). | 1 |
| DNM:Fromer_2014 | Whole Exome Sequencing analysis | This study reported a WES study of 623 schizophrenia trios, reporting DNMs using genomic DNA. | |
| PMID:cooccur | High-throughput literature-search | Systematic search in PubMed for genes co-occurring with SCZ keywords. A total of 3027 genes were included. | |
| GSMA_IIE | Genome scan meta-analysis (European-ancestry samples) | Psr: 0.01775 | |
| Literature | High-throughput literature-search | Co-occurance with Schizophrenia keywords: schizophrenia,schizophrenias | Click to show details |
Section I. Genetics and epigenetics annotation
 DNM table
| Gene | Chromosome | Position | Ref | Alt | Transcript | AA change | Mutation type | Sift | CG46 | Trait | Study |
|---|---|---|---|---|---|---|---|---|---|---|---|
| COG7 | chr16 | 23430055 | C | T | NM_153603 | p.368S>N | missense | Schizophrenia | DNM:Fromer_2014 |
Differentially methylated gene
| Probe | Chromosome | Position | Nearest gene | P (dis) | Beta (dis) | FDR (dis) | Study |
|---|---|---|---|---|---|---|---|
| cg04723449 | 16 | 23420567 | COG7 | 3.125E-4 | 0.494 | 0.04 | DMG:Wockner_2014 |
Section II. Transcriptome annotation
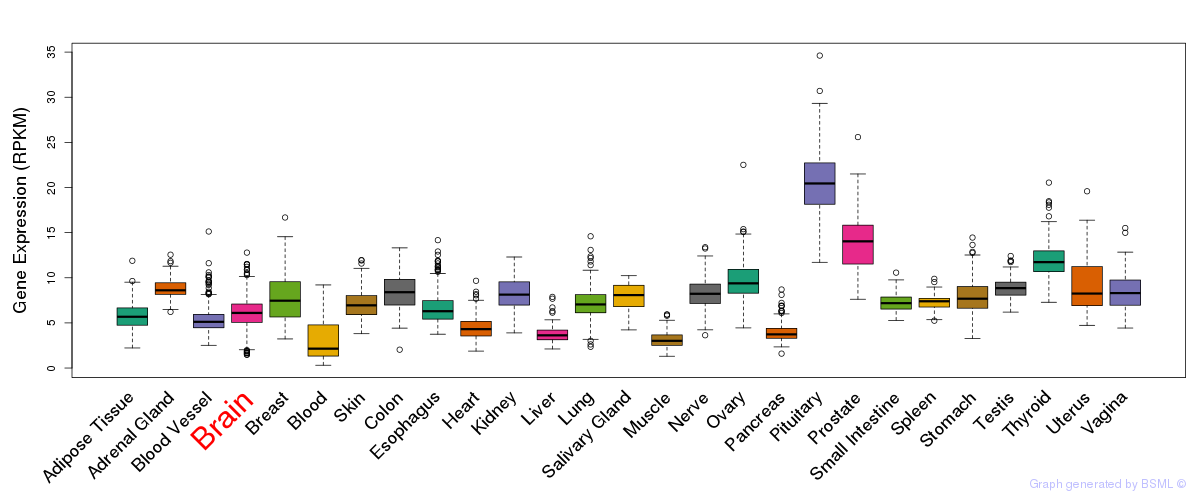
General gene expression (GTEx)
Gene expression during devlopment (BrainCloud)
Footnote:
A total of 269 time points ploted, with n=38 fetal samples (x=1:38). Each triangle represents one time point.
Gene expression of temporal and spatial changes (BrainSpan)
Footnote:
SC: sub-cortical regions; SM: sensory-motor regions; FC: frontal cortex; and TP: temporal-parietal cortex
ST1: fetal (13 - 26 postconception weeks), ST2: early infancy to late childhood (4 months to 11 years), and ST3: adolescence to adulthood (13 - 23 years)
The bar shown representes the lower 25% and upper 25% of the expression distribution.
No co-expressed genes in brain regions
Section III. Gene Ontology annotation
| Molecular function | GO term | Evidence | Neuro keywords | PubMed ID |
|---|---|---|---|---|
| GO:0005515 | protein binding | IPI | 15047703 | |
| Biological process | GO term | Evidence | Neuro keywords | PubMed ID |
| GO:0006486 | protein amino acid glycosylation | IMP | 15107842 |16420527 | |
| GO:0034067 | protein localization in Golgi apparatus | IMP | 16510524 | |
| GO:0006886 | intracellular protein transport | IMP | 15107842 | |
| GO:0006890 | retrograde vesicle-mediated transport, Golgi to ER | IMP | 16420527 |16510524 | |
| GO:0050821 | protein stabilization | IMP | 16420527 |16510524 | |
| Cellular component | GO term | Evidence | Neuro keywords | PubMed ID |
| GO:0000139 | Golgi membrane | IEA | - | |
| GO:0005794 | Golgi apparatus | IDA | 11980916 | |
| GO:0016020 | membrane | IEA | - | |
| GO:0017119 | Golgi transport complex | IDA | 15047703 |
Section V. Pathway annotation
| Pathway name | Pathway size | # SZGR 2.0 genes in pathway | Info |
|---|---|---|---|
| CHARAFE BREAST CANCER LUMINAL VS MESENCHYMAL UP | 450 | 256 | All SZGR 2.0 genes in this pathway |
| BALLIF DEVELOPMENTAL DISABILITY P16 P12 DELETION | 13 | 8 | All SZGR 2.0 genes in this pathway |
| BENPORATH NANOG TARGETS | 988 | 594 | All SZGR 2.0 genes in this pathway |
| BROWNE HCMV INFECTION 48HR DN | 504 | 323 | All SZGR 2.0 genes in this pathway |
| CREIGHTON ENDOCRINE THERAPY RESISTANCE 2 | 473 | 224 | All SZGR 2.0 genes in this pathway |
| SMID BREAST CANCER BASAL DN | 701 | 446 | All SZGR 2.0 genes in this pathway |
| BROWNE HCMV INFECTION 4HR DN | 254 | 158 | All SZGR 2.0 genes in this pathway |