Gene Page: CACNA2D4
Summary ?
| GeneID | 93589 |
| Symbol | CACNA2D4 |
| Synonyms | RCD4 |
| Description | calcium voltage-gated channel auxiliary subunit alpha2delta 4 |
| Reference | MIM:608171|HGNC:HGNC:20202|Ensembl:ENSG00000151062|HPRD:12182|Vega:OTTHUMG00000168111 |
| Gene type | protein-coding |
| Map location | 12p13.33 |
| Pascal p-value | 6.269E-4 |
| Fetal beta | 0.325 |
| DMG | 1 (# studies) |
| eGene | Caudate basal ganglia Putamen basal ganglia Myers' cis & trans |
| Support | CANABINOID DOPAMINE EXCITABILITY METABOTROPIC GLUTAMATE RECEPTOR SEROTONIN CompositeSet |
Gene in Data Sources
| Gene set name | Method of gene set | Description | Info |
|---|---|---|---|
| CV:PGCnp | Genome-wide Association Study | GWAS | |
| DMG:Wockner_2014 | Genome-wide DNA methylation analysis | This dataset includes 4641 differentially methylated probes corresponding to 2929 unique genes between schizophrenia patients (n=24) and controls (n=24). | 2 |
| PMID:cooccur | High-throughput literature-search | Systematic search in PubMed for genes co-occurring with SCZ keywords. A total of 3027 genes were included. | |
| Literature | High-throughput literature-search | Co-occurance with Schizophrenia keywords: schizophrenia,schizophrenias | Click to show details |
Section I. Genetics and epigenetics annotation
 Differentially methylated gene
| Probe | Chromosome | Position | Nearest gene | P (dis) | Beta (dis) | FDR (dis) | Study |
|---|---|---|---|---|---|---|---|
| cg24105081 | 12 | 1947479 | CACNA2D4 | 1.212E-4 | 0.797 | 0.029 | DMG:Wockner_2014 |
| cg06937491 | 12 | 1943722 | LRTM2;CACNA2D4 | 3.233E-4 | 0.671 | 0.04 | DMG:Wockner_2014 |
eQTL annotation
| SNP ID | Chromosome | Position | eGene | Gene Entrez ID | pvalue | qvalue | TSS distance | eQTL type |
|---|---|---|---|---|---|---|---|---|
| rs6666913 | chr1 | 237092144 | CACNA2D4 | 93589 | 0.03 | trans | ||
| rs16865199 | chr2 | 6621910 | CACNA2D4 | 93589 | 0.18 | trans | ||
| rs16865228 | chr2 | 6629622 | CACNA2D4 | 93589 | 0.17 | trans | ||
| rs16865230 | chr2 | 6630187 | CACNA2D4 | 93589 | 0.17 | trans | ||
| rs11691188 | chr2 | 6631799 | CACNA2D4 | 93589 | 0.17 | trans | ||
| rs7609917 | chr3 | 76094301 | CACNA2D4 | 93589 | 0.1 | trans | ||
| rs2324466 | chr3 | 76100753 | CACNA2D4 | 93589 | 0.04 | trans | ||
| rs17013713 | chr3 | 76105150 | CACNA2D4 | 93589 | 0.08 | trans | ||
| rs17013722 | chr3 | 76107656 | CACNA2D4 | 93589 | 0.04 | trans | ||
| rs17013724 | chr3 | 76107684 | CACNA2D4 | 93589 | 0.04 | trans | ||
| rs11734196 | chr4 | 102796071 | CACNA2D4 | 93589 | 0.04 | trans | ||
| rs10212684 | chr4 | 102822506 | CACNA2D4 | 93589 | 0.01 | trans | ||
| rs9986296 | chr5 | 3199318 | CACNA2D4 | 93589 | 0.08 | trans | ||
| rs16896683 | chr6 | 43687846 | CACNA2D4 | 93589 | 0.17 | trans | ||
| rs1017329 | chr8 | 40281396 | CACNA2D4 | 93589 | 0.13 | trans | ||
| rs16920368 | chr8 | 55392852 | CACNA2D4 | 93589 | 0.05 | trans | ||
| rs2069410 | chr12 | 56364644 | CACNA2D4 | 93589 | 9.923E-4 | trans | ||
| rs11115597 | chr12 | 83509142 | CACNA2D4 | 93589 | 0.05 | trans | ||
| rs11105124 | chr12 | 89375908 | CACNA2D4 | 93589 | 0.14 | trans | ||
| rs4770243 | chr13 | 22662276 | CACNA2D4 | 93589 | 0.1 | trans | ||
| rs17834315 | chr13 | 37991091 | CACNA2D4 | 93589 | 0.01 | trans | ||
| rs9542625 | chr13 | 71811344 | CACNA2D4 | 93589 | 0.05 | trans | ||
| rs16939821 | chr15 | 58449860 | CACNA2D4 | 93589 | 0.19 | trans | ||
| rs16946329 | chr15 | 63324362 | CACNA2D4 | 93589 | 0.11 | trans | ||
| rs17142983 | chr16 | 7294508 | CACNA2D4 | 93589 | 0.04 | trans | ||
| rs6514759 | 0 | CACNA2D4 | 93589 | 0.17 | trans | |||
| rs12811035 | 12 | 1901546 | CACNA2D4 | ENSG00000151062.10 | 3.008E-6 | 0 | 126456 | gtex_brain_putamen_basal |
| rs6489330 | 12 | 1907853 | CACNA2D4 | ENSG00000151062.10 | 1.418E-7 | 0 | 120149 | gtex_brain_putamen_basal |
| rs2286378 | 12 | 1909979 | CACNA2D4 | ENSG00000151062.10 | 1.218E-7 | 0 | 118023 | gtex_brain_putamen_basal |
Section II. Transcriptome annotation
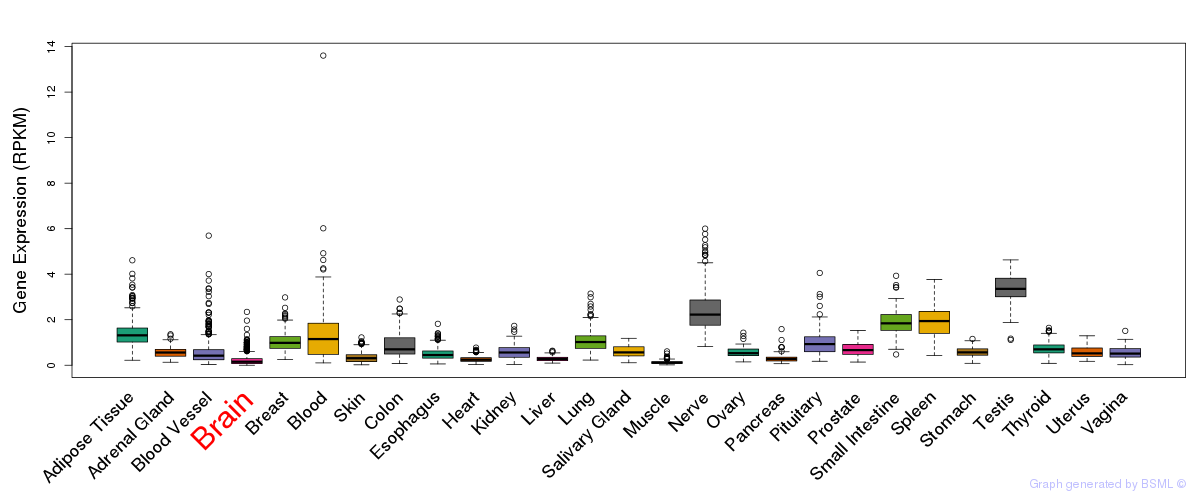
General gene expression (GTEx)
Gene expression during devlopment (BrainCloud)
Footnote:
A total of 269 time points ploted, with n=38 fetal samples (x=1:38). Each triangle represents one time point.
Gene expression of temporal and spatial changes (BrainSpan)
Footnote:
SC: sub-cortical regions; SM: sensory-motor regions; FC: frontal cortex; and TP: temporal-parietal cortex
ST1: fetal (13 - 26 postconception weeks), ST2: early infancy to late childhood (4 months to 11 years), and ST3: adolescence to adulthood (13 - 23 years)
The bar shown representes the lower 25% and upper 25% of the expression distribution.
No co-expressed genes in brain regions
Section V. Pathway annotation
| Pathway name | Pathway size | # SZGR 2.0 genes in pathway | Info |
|---|---|---|---|
| KEGG MAPK SIGNALING PATHWAY | 267 | 205 | All SZGR 2.0 genes in this pathway |
| KEGG CARDIAC MUSCLE CONTRACTION | 80 | 51 | All SZGR 2.0 genes in this pathway |
| KEGG HYPERTROPHIC CARDIOMYOPATHY HCM | 85 | 65 | All SZGR 2.0 genes in this pathway |
| KEGG ARRHYTHMOGENIC RIGHT VENTRICULAR CARDIOMYOPATHY ARVC | 76 | 59 | All SZGR 2.0 genes in this pathway |
| KEGG DILATED CARDIOMYOPATHY | 92 | 68 | All SZGR 2.0 genes in this pathway |
| MOHANKUMAR TLX1 TARGETS UP | 414 | 287 | All SZGR 2.0 genes in this pathway |
| MARIADASON RESPONSE TO BUTYRATE SULINDAC 4 | 21 | 12 | All SZGR 2.0 genes in this pathway |
| KRIGE RESPONSE TO TOSEDOSTAT 6HR UP | 953 | 554 | All SZGR 2.0 genes in this pathway |
| KRIGE RESPONSE TO TOSEDOSTAT 24HR UP | 783 | 442 | All SZGR 2.0 genes in this pathway |