Gene Page: ZBTB40
Summary ?
| GeneID | 9923 |
| Symbol | ZBTB40 |
| Synonyms | ZNF923 |
| Description | zinc finger and BTB domain containing 40 |
| Reference | MIM:612106|HGNC:HGNC:29045|Ensembl:ENSG00000184677|HPRD:11086|Vega:OTTHUMG00000002897 |
| Gene type | protein-coding |
| Map location | 1p36 |
| Pascal p-value | 0.808 |
| Sherlock p-value | 0.862 |
| Fetal beta | 1.161 |
| eGene | Myers' cis & trans Meta |
| Support | CompositeSet |
Gene in Data Sources
| Gene set name | Method of gene set | Description | Info |
|---|---|---|---|
| CV:PGCnp | Genome-wide Association Study | GWAS | |
| DNM:Xu_2012 | Whole Exome Sequencing analysis | De novo mutations of 4 genes were identified by exome sequencing of 795 samples in this study |
Section I. Genetics and epigenetics annotation
 DNM table
| Gene | Chromosome | Position | Ref | Alt | Transcript | AA change | Mutation type | Sift | CG46 | Trait | Study |
|---|---|---|---|---|---|---|---|---|---|---|---|
| ZBTB40 | chr1 | 22850725 | C | T | NM_001083621 NM_014870 | p.1105R>W p.1105R>W | missense missense | Schizophrenia | DNM:Xu_2012 |
eQTL annotation
| SNP ID | Chromosome | Position | eGene | Gene Entrez ID | pvalue | qvalue | TSS distance | eQTL type |
|---|---|---|---|---|---|---|---|---|
| rs16826595 | chr1 | 22425861 | ZBTB40 | 9923 | 0.02 | cis | ||
| rs10915848 | chr1 | 225788919 | ZBTB40 | 9923 | 0.18 | trans | ||
| rs7584986 | chr2 | 184111432 | ZBTB40 | 9923 | 0.01 | trans | ||
| rs1155107 | chr3 | 26843376 | ZBTB40 | 9923 | 0.11 | trans | ||
| rs17029291 | chr3 | 32402138 | ZBTB40 | 9923 | 0.01 | trans | ||
| rs6771817 | chr3 | 165557099 | ZBTB40 | 9923 | 0.14 | trans | ||
| rs830202 | chr3 | 165654796 | ZBTB40 | 9923 | 0.04 | trans | ||
| rs17415971 | chr4 | 14272434 | ZBTB40 | 9923 | 0.15 | trans | ||
| rs4645225 | chr4 | 126010830 | ZBTB40 | 9923 | 0.14 | trans | ||
| rs6882818 | chr5 | 55987580 | ZBTB40 | 9923 | 0.03 | trans | ||
| rs1432030 | chr8 | 133175445 | ZBTB40 | 9923 | 0.08 | trans | ||
| rs7894597 | chr10 | 9384581 | ZBTB40 | 9923 | 0 | trans | ||
| rs7076439 | chr10 | 93286841 | ZBTB40 | 9923 | 0.06 | trans | ||
| rs11186601 | chr10 | 93287199 | ZBTB40 | 9923 | 0.01 | trans | ||
| rs1324669 | chr13 | 107872446 | ZBTB40 | 9923 | 3.155E-4 | trans | ||
| rs16958358 | chr17 | 55502410 | ZBTB40 | 9923 | 0.17 | trans | ||
| rs6098023 | chr20 | 53113740 | ZBTB40 | 9923 | 0.03 | trans | ||
| rs17145698 | chrX | 40218345 | ZBTB40 | 9923 | 0 | trans | ||
| rs17264923 | chrX | 69499164 | ZBTB40 | 9923 | 0.01 | trans |
Section II. Transcriptome annotation
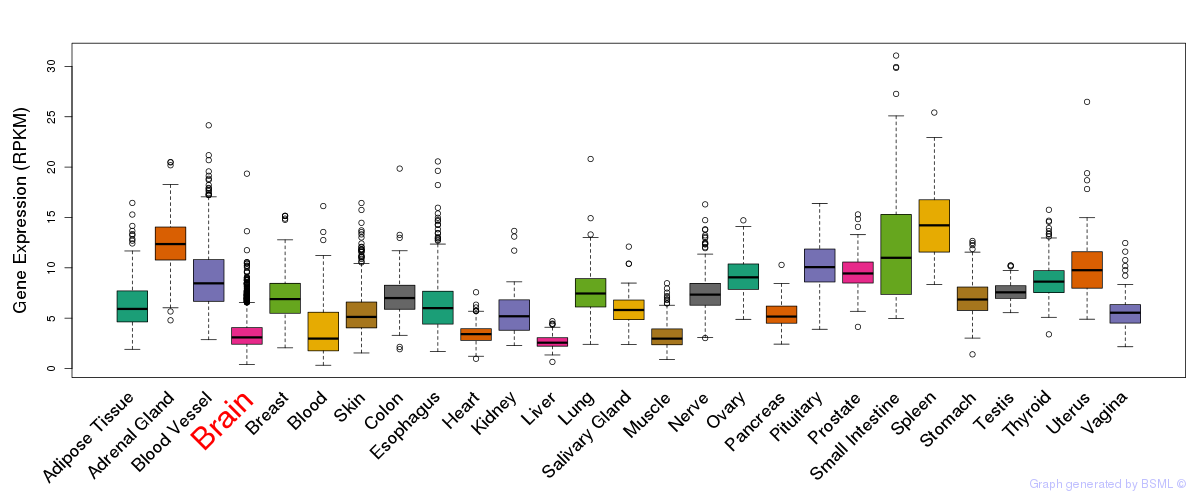
General gene expression (GTEx)
Gene expression during devlopment (BrainCloud)
Footnote:
A total of 269 time points ploted, with n=38 fetal samples (x=1:38). Each triangle represents one time point.
Gene expression of temporal and spatial changes (BrainSpan)
Footnote:
SC: sub-cortical regions; SM: sensory-motor regions; FC: frontal cortex; and TP: temporal-parietal cortex
ST1: fetal (13 - 26 postconception weeks), ST2: early infancy to late childhood (4 months to 11 years), and ST3: adolescence to adulthood (13 - 23 years)
The bar shown representes the lower 25% and upper 25% of the expression distribution.
Top co-expressed genes in brain regions
| Top 10 positively co-expressed genes | ||
| Gene | Pearson's Correlation | Spearman's Correlation |
| SLC25A28 | 0.61 | 0.61 |
| TYK2 | 0.61 | 0.61 |
| MAN2C1 | 0.60 | 0.61 |
| AGXT2L2 | 0.60 | 0.60 |
| TMEM129 | 0.60 | 0.58 |
| RECQL5 | 0.58 | 0.60 |
| ANGEL1 | 0.57 | 0.60 |
| SLC39A13 | 0.57 | 0.59 |
| PNPLA2 | 0.57 | 0.58 |
| TMEM175 | 0.56 | 0.57 |
| Top 10 negatively co-expressed genes | ||
| Gene | Pearson's Correlation | Spearman's Correlation |
| SEC62 | -0.35 | -0.38 |
| GNG11 | -0.31 | -0.32 |
| RP11-3P17.1 | -0.30 | -0.33 |
| SNRPG | -0.29 | -0.31 |
| FAM159B | -0.29 | -0.40 |
| SPINK8 | -0.28 | -0.30 |
| AC011475.1 | -0.28 | -0.32 |
| EIF3J | -0.28 | -0.21 |
| AC051635.1 | -0.27 | -0.26 |
| AC108145.1 | -0.27 | -0.25 |
Section V. Pathway annotation
| Pathway name | Pathway size | # SZGR 2.0 genes in pathway | Info |
|---|---|---|---|
| WATTEL AUTONOMOUS THYROID ADENOMA UP | 73 | 47 | All SZGR 2.0 genes in this pathway |
| BUYTAERT PHOTODYNAMIC THERAPY STRESS UP | 811 | 508 | All SZGR 2.0 genes in this pathway |
| RAY TUMORIGENESIS BY ERBB2 CDC25A DN | 159 | 105 | All SZGR 2.0 genes in this pathway |
| VANTVEER BREAST CANCER ESR1 UP | 167 | 99 | All SZGR 2.0 genes in this pathway |
| WAKABAYASHI ADIPOGENESIS PPARG BOUND 8D | 658 | 397 | All SZGR 2.0 genes in this pathway |