Gene Page: MAGEC1
Summary ?
| GeneID | 9947 |
| Symbol | MAGEC1 |
| Synonyms | CT7|CT7.1 |
| Description | MAGE family member C1 |
| Reference | MIM:300223|HGNC:HGNC:6812|Ensembl:ENSG00000155495|HPRD:02201|Vega:OTTHUMG00000022569 |
| Gene type | protein-coding |
| Map location | Xq26 |
| Support | CompositeSet |
Gene in Data Sources
| Gene set name | Method of gene set | Description | Info |
|---|---|---|---|
| CV:PGCnp | Genome-wide Association Study | GWAS | |
| DNM:Xu_2012 | Whole Exome Sequencing analysis | De novo mutations of 4 genes were identified by exome sequencing of 795 samples in this study |
Section I. Genetics and epigenetics annotation
 DNM table
| Gene | Chromosome | Position | Ref | Alt | Transcript | AA change | Mutation type | Sift | CG46 | Trait | Study |
|---|---|---|---|---|---|---|---|---|---|---|---|
| MAGEC1 | chrX | 140993957 | C | G | NM_005462 | p.256T>S | missense | Schizophrenia | DNM:Xu_2012 |
Section II. Transcriptome annotation
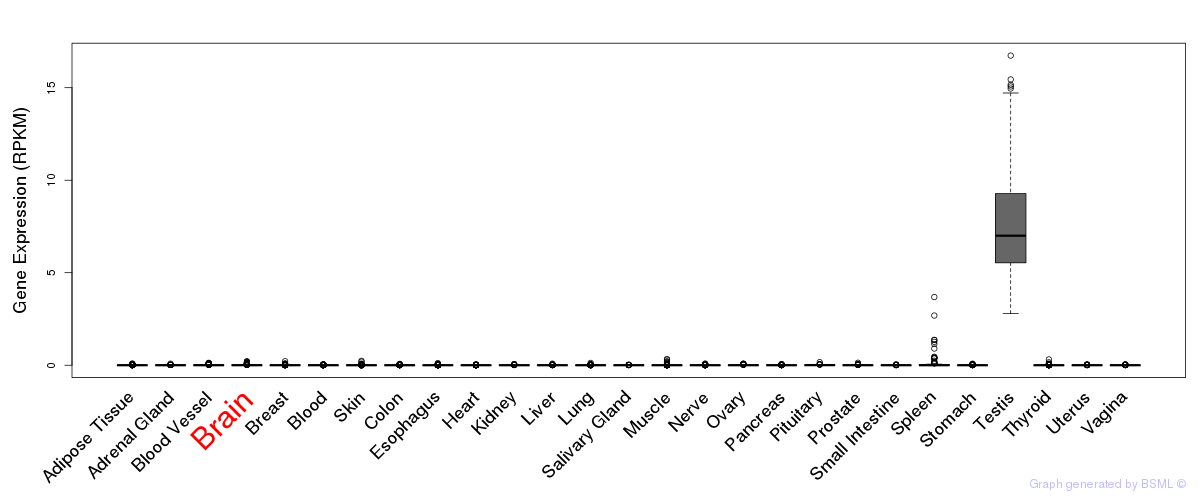
General gene expression (GTEx)
Gene expression of temporal and spatial changes (BrainSpan)
Footnote:
SC: sub-cortical regions; SM: sensory-motor regions; FC: frontal cortex; and TP: temporal-parietal cortex
ST1: fetal (13 - 26 postconception weeks), ST2: early infancy to late childhood (4 months to 11 years), and ST3: adolescence to adulthood (13 - 23 years)
The bar shown representes the lower 25% and upper 25% of the expression distribution.
Top co-expressed genes in brain regions
| Top 10 positively co-expressed genes | ||
| Gene | Pearson's Correlation | Spearman's Correlation |
| PWP1 | 0.93 | 0.94 |
| CRK | 0.93 | 0.92 |
| VTA1 | 0.93 | 0.96 |
| GLOD4 | 0.92 | 0.95 |
| PRKAR2B | 0.92 | 0.94 |
| FAM164A | 0.92 | 0.94 |
| ARMCX1 | 0.92 | 0.95 |
| ZNF436 | 0.92 | 0.93 |
| PKIA | 0.91 | 0.95 |
| MAPK8 | 0.91 | 0.94 |
| Top 10 negatively co-expressed genes | ||
| Gene | Pearson's Correlation | Spearman's Correlation |
| MT-CO2 | -0.75 | -0.88 |
| HLA-F | -0.74 | -0.81 |
| AF347015.33 | -0.74 | -0.87 |
| AF347015.31 | -0.74 | -0.86 |
| AIFM3 | -0.74 | -0.81 |
| HEPN1 | -0.73 | -0.81 |
| TSC22D4 | -0.73 | -0.83 |
| FXYD1 | -0.73 | -0.87 |
| MT-CYB | -0.72 | -0.86 |
| AF347015.27 | -0.72 | -0.85 |
Section V. Pathway annotation
| Pathway name | Pathway size | # SZGR 2.0 genes in pathway | Info |
|---|---|---|---|
| PARENT MTOR SIGNALING UP | 567 | 375 | All SZGR 2.0 genes in this pathway |
| ZHONG RESPONSE TO AZACITIDINE AND TSA UP | 183 | 119 | All SZGR 2.0 genes in this pathway |
| MISSIAGLIA REGULATED BY METHYLATION UP | 126 | 78 | All SZGR 2.0 genes in this pathway |
| HAMAI APOPTOSIS VIA TRAIL DN | 186 | 107 | All SZGR 2.0 genes in this pathway |
| SATO SILENCED EPIGENETICALLY IN PANCREATIC CANCER | 49 | 30 | All SZGR 2.0 genes in this pathway |
| HELLER SILENCED BY METHYLATION UP | 282 | 183 | All SZGR 2.0 genes in this pathway |
| HELLER HDAC TARGETS SILENCED BY METHYLATION UP | 461 | 298 | All SZGR 2.0 genes in this pathway |
| ZHAN MULTIPLE MYELOMA MS DN | 46 | 24 | All SZGR 2.0 genes in this pathway |
| PURBEY TARGETS OF CTBP1 NOT SATB1 UP | 344 | 215 | All SZGR 2.0 genes in this pathway |