Gene Page: PTBP3
Summary ?
| GeneID | 9991 |
| Symbol | PTBP3 |
| Synonyms | ROD1 |
| Description | polypyrimidine tract binding protein 3 |
| Reference | MIM:607527|HGNC:HGNC:10253|Ensembl:ENSG00000119314|HPRD:09603|Vega:OTTHUMG00000020503 |
| Gene type | protein-coding |
| Map location | 9q32 |
| Pascal p-value | 2.673E-4 |
| DEG p-value | DEG:Sanders_2014:DS1_p=0.159:DS1_beta=0.022300:DS2_p=5.57e-01:DS2_beta=0.030:DS2_FDR=7.67e-01 |
| Fetal beta | 0.802 |
Gene in Data Sources
| Gene set name | Method of gene set | Description | Info |
|---|---|---|---|
| CV:PGCnp | Genome-wide Association Study | GWAS | |
| DEG:Sanders_2013 | Microarray | Whole-genome gene expression profiles using microarrays on lymphoblastoid cell lines (LCLs) from 413 cases and 446 controls. |
Section I. Genetics and epigenetics annotation
Section II. Transcriptome annotation
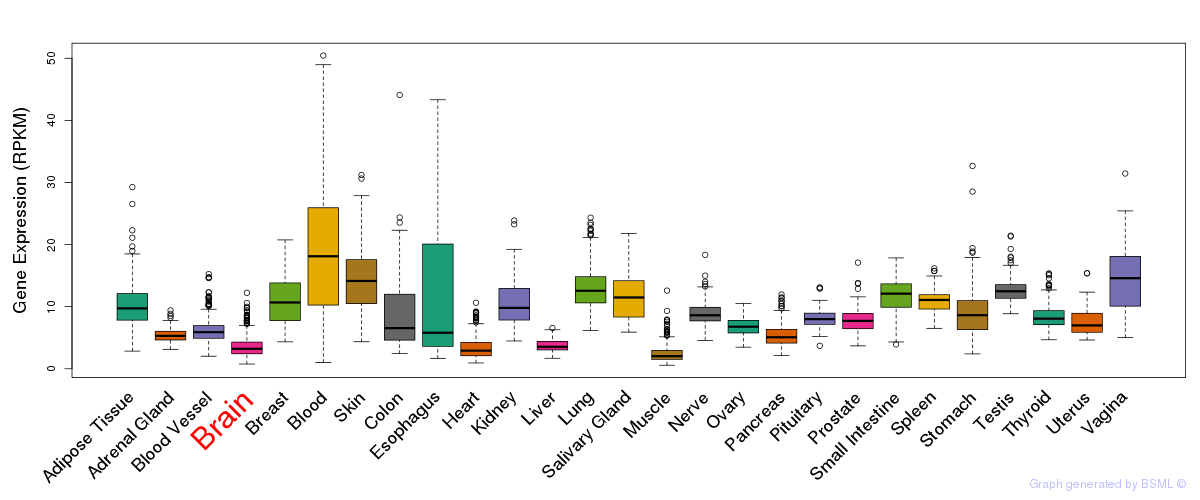
General gene expression (GTEx)
Gene expression during devlopment (BrainCloud)
Footnote:
A total of 269 time points ploted, with n=38 fetal samples (x=1:38). Each triangle represents one time point.
Gene expression of temporal and spatial changes (BrainSpan)
Footnote:
SC: sub-cortical regions; SM: sensory-motor regions; FC: frontal cortex; and TP: temporal-parietal cortex
ST1: fetal (13 - 26 postconception weeks), ST2: early infancy to late childhood (4 months to 11 years), and ST3: adolescence to adulthood (13 - 23 years)
The bar shown representes the lower 25% and upper 25% of the expression distribution.