Gene Page: MARC2
Summary ?
| GeneID | 54996 |
| Symbol | MARC2 |
| Synonyms | MOSC2 |
| Description | mitochondrial amidoxime reducing component 2 |
| Reference | MIM:614127|HGNC:HGNC:26064|HPRD:08628| |
| Gene type | protein-coding |
| Map location | 1q41 |
| Sherlock p-value | 0.106 |
Gene in Data Sources
| Gene set name | Method of gene set | Description | Info |
|---|---|---|---|
| CV:GWAScat | Genome-wide Association Studies | This data set includes 560 SNPs associated with schizophrenia. A total of 486 genes were mapped to these SNPs within 50kb. | |
| CV:PGCnp | Genome-wide Association Study | GWAS |
Section I. Genetics and epigenetics annotation
Section II. Transcriptome annotation
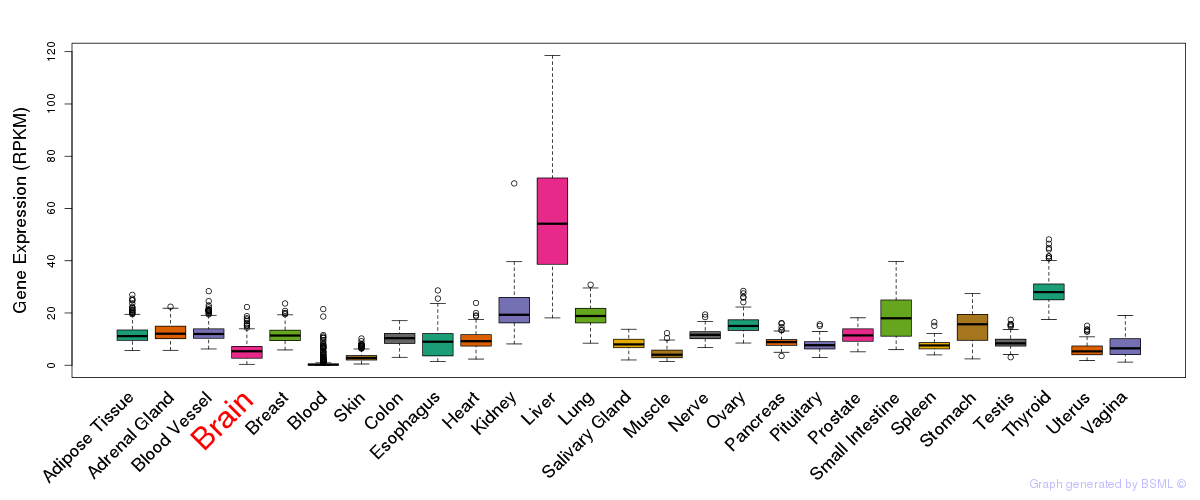
General gene expression (GTEx)
Gene expression of temporal and spatial changes (BrainSpan)
Footnote:
SC: sub-cortical regions; SM: sensory-motor regions; FC: frontal cortex; and TP: temporal-parietal cortex
ST1: fetal (13 - 26 postconception weeks), ST2: early infancy to late childhood (4 months to 11 years), and ST3: adolescence to adulthood (13 - 23 years)
The bar shown representes the lower 25% and upper 25% of the expression distribution.
Top co-expressed genes in brain regions
| Top 10 positively co-expressed genes | ||
| Gene | Pearson's Correlation | Spearman's Correlation |
| INPP5F | 0.81 | 0.78 |
| PIGW | 0.80 | 0.82 |
| VPS8 | 0.80 | 0.77 |
| BRWD2 | 0.79 | 0.80 |
| ARMCX2 | 0.78 | 0.76 |
| FTSJD2 | 0.78 | 0.79 |
| C14orf101 | 0.78 | 0.78 |
| ATP1B3 | 0.78 | 0.74 |
| IKBKAP | 0.77 | 0.78 |
| UBE3C | 0.77 | 0.77 |
| Top 10 negatively co-expressed genes | ||
| Gene | Pearson's Correlation | Spearman's Correlation |
| MT-CO2 | -0.68 | -0.65 |
| AF347015.31 | -0.67 | -0.63 |
| AF347015.21 | -0.67 | -0.64 |
| AF347015.8 | -0.67 | -0.64 |
| AF347015.2 | -0.66 | -0.62 |
| HIGD1B | -0.65 | -0.64 |
| MT-CYB | -0.65 | -0.60 |
| AF347015.33 | -0.65 | -0.60 |
| AF347015.27 | -0.62 | -0.59 |
| FXYD1 | -0.62 | -0.60 |