Gene Page: NDST3
Summary ?
| GeneID | 9348 |
| Symbol | NDST3 |
| Synonyms | HSST3 |
| Description | N-deacetylase/N-sulfotransferase 3 |
| Reference | MIM:603950|HGNC:HGNC:7682|Ensembl:ENSG00000164100|Vega:OTTHUMG00000132959 |
| Gene type | protein-coding |
| Map location | 4q26 |
| Pascal p-value | 3.839E-4 |
| Sherlock p-value | 0.785 |
| Fetal beta | -0.434 |
| eGene | Myers' cis & trans |
Gene in Data Sources
| Gene set name | Method of gene set | Description | Info |
|---|---|---|---|
| CV:GWAScat | Genome-wide Association Studies | This data set includes 560 SNPs associated with schizophrenia. A total of 486 genes were mapped to these SNPs within 50kb. | |
| CV:GWASdb | Genome-wide Association Studies | GWASdb records for schizophrenia | |
| CV:PGCnp | Genome-wide Association Study | GWAS | |
| PMID:cooccur | High-throughput literature-search | Systematic search in PubMed for genes co-occurring with SCZ keywords. A total of 3027 genes were included. | |
| Expression | Meta-analysis of gene expression | P value: 1.959 | |
| Literature | High-throughput literature-search | Co-occurance with Schizophrenia keywords: schizophrenia,schizophrenias | Click to show details |
Section I. Genetics and epigenetics annotation
 eQTL annotation
| SNP ID | Chromosome | Position | eGene | Gene Entrez ID | pvalue | qvalue | TSS distance | eQTL type |
|---|---|---|---|---|---|---|---|---|
| rs17029291 | chr3 | 32402138 | NDST3 | 9348 | 8.465E-6 | trans | ||
| rs830202 | chr3 | 165654796 | NDST3 | 9348 | 0.19 | trans | ||
| rs7894597 | chr10 | 9384581 | NDST3 | 9348 | 0.13 | trans | ||
| rs1324669 | chr13 | 107872446 | NDST3 | 9348 | 0.07 | trans | ||
| rs17145698 | chrX | 40218345 | NDST3 | 9348 | 0.14 | trans |
Section II. Transcriptome annotation
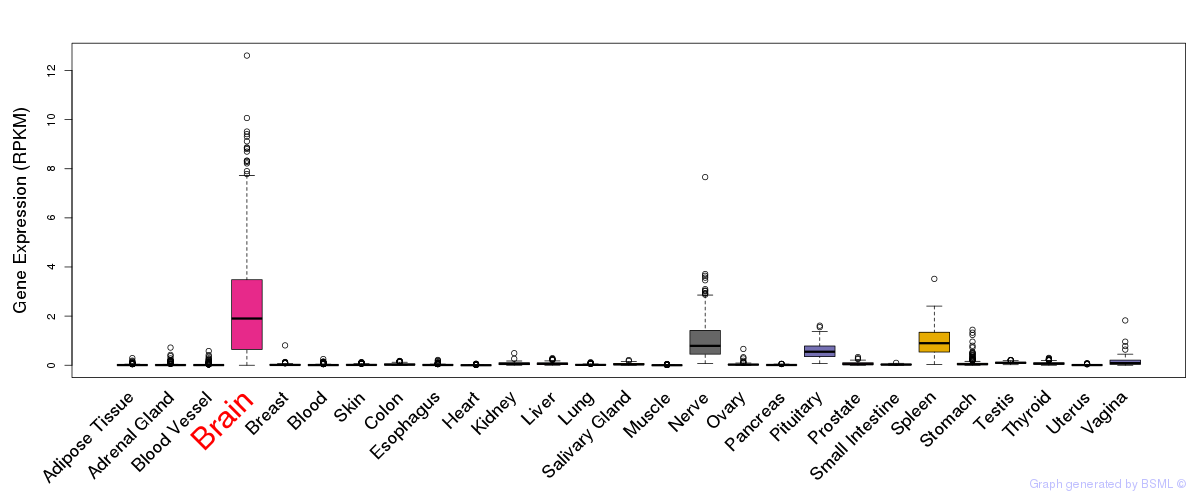
General gene expression (GTEx)
Gene expression during devlopment (BrainCloud)
Footnote:
A total of 269 time points ploted, with n=38 fetal samples (x=1:38). Each triangle represents one time point.
Gene expression of temporal and spatial changes (BrainSpan)
Footnote:
SC: sub-cortical regions; SM: sensory-motor regions; FC: frontal cortex; and TP: temporal-parietal cortex
ST1: fetal (13 - 26 postconception weeks), ST2: early infancy to late childhood (4 months to 11 years), and ST3: adolescence to adulthood (13 - 23 years)
The bar shown representes the lower 25% and upper 25% of the expression distribution.
Top co-expressed genes in brain regions
| Top 10 positively co-expressed genes | ||
| Gene | Pearson's Correlation | Spearman's Correlation |
| LPAR6 | 0.74 | 0.68 |
| LY96 | 0.74 | 0.60 |
| AL050337.1 | 0.71 | 0.52 |
| AL138743.2 | 0.70 | 0.57 |
| CGRRF1 | 0.70 | 0.68 |
| SPDYA | 0.69 | 0.34 |
| ACOT13 | 0.69 | 0.70 |
| IMMP1L | 0.68 | 0.69 |
| MTCP1NB | 0.68 | 0.66 |
| SCRG1 | 0.68 | 0.59 |
| Top 10 negatively co-expressed genes | ||
| Gene | Pearson's Correlation | Spearman's Correlation |
| TNKS1BP1 | -0.54 | -0.55 |
| MYO18A | -0.52 | -0.48 |
| FAM129B | -0.52 | -0.61 |
| CLIP2 | -0.52 | -0.53 |
| CADM4 | -0.51 | -0.52 |
| SMG6 | -0.51 | -0.49 |
| PHACTR3 | -0.50 | -0.48 |
| DHX37 | -0.50 | -0.51 |
| WDR81 | -0.50 | -0.47 |
| SUPT6H | -0.50 | -0.47 |
Section III. Gene Ontology annotation
| Molecular function | GO term | Evidence | Neuro keywords | PubMed ID |
|---|---|---|---|---|
| GO:0016787 | hydrolase activity | IEA | - | |
| GO:0016740 | transferase activity | IEA | - | |
| GO:0008146 | sulfotransferase activity | IEA | - | |
| GO:0015016 | [heparan sulfate]-glucosamine N-sulfotransferase activity | IEA | - | |
| Cellular component | GO term | Evidence | Neuro keywords | PubMed ID |
| GO:0000139 | Golgi membrane | IEA | - | |
| GO:0005794 | Golgi apparatus | IEA | - | |
| GO:0016020 | membrane | IEA | - | |
| GO:0016021 | integral to membrane | IEA | - |
Section V. Pathway annotation
| Pathway name | Pathway size | # SZGR 2.0 genes in pathway | Info |
|---|---|---|---|
| KEGG GLYCOSAMINOGLYCAN BIOSYNTHESIS HEPARAN SULFATE | 26 | 16 | All SZGR 2.0 genes in this pathway |
| REACTOME HS GAG BIOSYNTHESIS | 31 | 17 | All SZGR 2.0 genes in this pathway |
| REACTOME HEPARAN SULFATE HEPARIN HS GAG METABOLISM | 52 | 33 | All SZGR 2.0 genes in this pathway |
| REACTOME GLYCOSAMINOGLYCAN METABOLISM | 111 | 69 | All SZGR 2.0 genes in this pathway |
| REACTOME METABOLISM OF CARBOHYDRATES | 247 | 154 | All SZGR 2.0 genes in this pathway |
| IWANAGA CARCINOGENESIS BY KRAS PTEN DN | 353 | 226 | All SZGR 2.0 genes in this pathway |