Gene Page: SNUPN
Summary ?
| GeneID | 10073 |
| Symbol | SNUPN |
| Synonyms | KPNBL|RNUT1|Snurportin1 |
| Description | snurportin 1 |
| Reference | MIM:607902|HGNC:HGNC:14245|Ensembl:ENSG00000169371|HPRD:07441|Vega:OTTHUMG00000142833 |
| Gene type | protein-coding |
| Map location | 15q24.2 |
| Pascal p-value | 0.398 |
| Sherlock p-value | 0.426 |
| Fetal beta | -0.205 |
| DMG | 1 (# studies) |
| eGene | Caudate basal ganglia Cerebellar Hemisphere Cerebellum Nucleus accumbens basal ganglia Meta |
| Support | Ascano FMRP targets |
Gene in Data Sources
| Gene set name | Method of gene set | Description | Info |
|---|---|---|---|
| DMG:Wockner_2014 | Genome-wide DNA methylation analysis | This dataset includes 4641 differentially methylated probes corresponding to 2929 unique genes between schizophrenia patients (n=24) and controls (n=24). | 1 |
Section I. Genetics and epigenetics annotation
 Differentially methylated gene
| Probe | Chromosome | Position | Nearest gene | P (dis) | Beta (dis) | FDR (dis) | Study |
|---|---|---|---|---|---|---|---|
| cg15811902 | 15 | 75918385 | SNUPN | 3.107E-4 | -0.26 | 0.04 | DMG:Wockner_2014 |
Section II. Transcriptome annotation
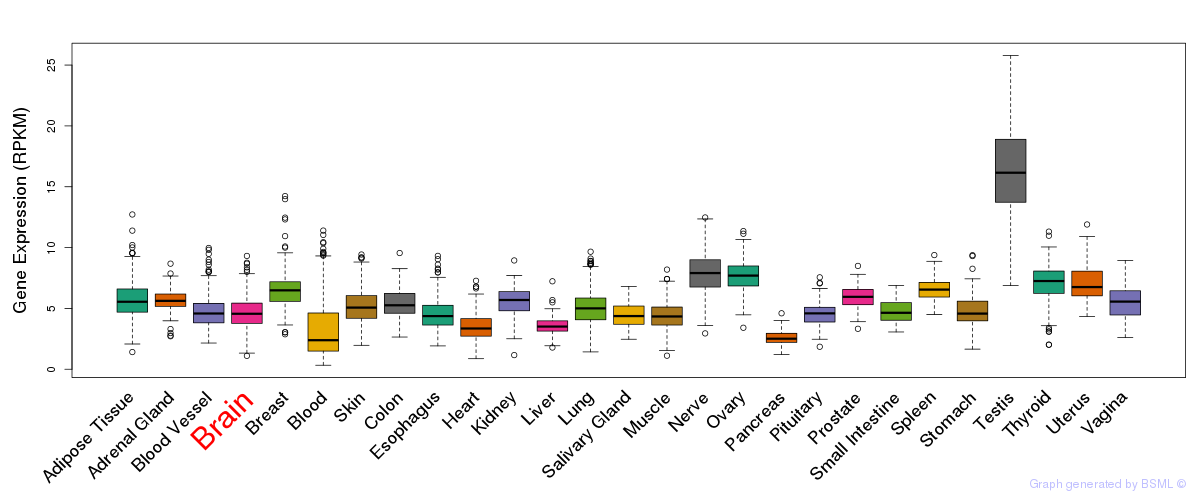
General gene expression (GTEx)
Gene expression during devlopment (BrainCloud)
Footnote:
A total of 269 time points ploted, with n=38 fetal samples (x=1:38). Each triangle represents one time point.
Gene expression of temporal and spatial changes (BrainSpan)
Footnote:
SC: sub-cortical regions; SM: sensory-motor regions; FC: frontal cortex; and TP: temporal-parietal cortex
ST1: fetal (13 - 26 postconception weeks), ST2: early infancy to late childhood (4 months to 11 years), and ST3: adolescence to adulthood (13 - 23 years)
The bar shown representes the lower 25% and upper 25% of the expression distribution.
Top co-expressed genes in brain regions
| Top 10 positively co-expressed genes | ||
| Gene | Pearson's Correlation | Spearman's Correlation |
| FAM54B | 0.63 | 0.62 |
| CIRH1A | 0.62 | 0.61 |
| MED8 | 0.62 | 0.61 |
| MLX | 0.61 | 0.59 |
| FBXO22 | 0.61 | 0.57 |
| TTC9C | 0.60 | 0.57 |
| ANAPC5 | 0.60 | 0.59 |
| PSMA1 | 0.60 | 0.59 |
| PREB | 0.60 | 0.56 |
| SLC25A38 | 0.60 | 0.58 |
| Top 10 negatively co-expressed genes | ||
| Gene | Pearson's Correlation | Spearman's Correlation |
| AF347015.18 | -0.54 | -0.60 |
| AF347015.8 | -0.52 | -0.49 |
| AF347015.26 | -0.52 | -0.52 |
| AL139819.3 | -0.51 | -0.48 |
| AF347015.27 | -0.49 | -0.49 |
| MT-CO2 | -0.49 | -0.45 |
| MT-ATP8 | -0.49 | -0.48 |
| AF347015.21 | -0.48 | -0.45 |
| AF347015.15 | -0.48 | -0.47 |
| AF347015.2 | -0.47 | -0.45 |
Section V. Pathway annotation
| Pathway name | Pathway size | # SZGR 2.0 genes in pathway | Info |
|---|---|---|---|
| REACTOME METABOLISM OF NON CODING RNA | 49 | 29 | All SZGR 2.0 genes in this pathway |
| REACTOME METABOLISM OF RNA | 330 | 155 | All SZGR 2.0 genes in this pathway |
| SPIELMAN LYMPHOBLAST EUROPEAN VS ASIAN DN | 584 | 395 | All SZGR 2.0 genes in this pathway |
| BENPORATH NANOG TARGETS | 988 | 594 | All SZGR 2.0 genes in this pathway |
| BENPORATH CYCLING GENES | 648 | 385 | All SZGR 2.0 genes in this pathway |
| IVANOVA HEMATOPOIESIS INTERMEDIATE PROGENITOR | 149 | 84 | All SZGR 2.0 genes in this pathway |
| BROWNE HCMV INFECTION 4HR DN | 254 | 158 | All SZGR 2.0 genes in this pathway |
| WHITFIELD CELL CYCLE M G1 | 148 | 95 | All SZGR 2.0 genes in this pathway |