Gene Page: CELA3A
Summary ?
| GeneID | 10136 |
| Symbol | CELA3A |
| Synonyms | ELA3|ELA3A |
| Description | chymotrypsin like elastase family member 3A |
| Reference | HGNC:HGNC:15944|Ensembl:ENSG00000142789|HPRD:06497|Vega:OTTHUMG00000002755 |
| Gene type | protein-coding |
| Map location | 1p36.12 |
| Pascal p-value | 0.084 |
| Fetal beta | 0.293 |
| DMG | 1 (# studies) |
Gene in Data Sources
| Gene set name | Method of gene set | Description | Info |
|---|---|---|---|
| CV:PGCnp | Genome-wide Association Study | GWAS | |
| DMG:Jaffe_2016 | Genome-wide DNA methylation analysis | This dataset includes 2,104 probes/CpGs associated with SZ patients (n=108) compared to 136 controls at Bonferroni-adjusted P < 0.05. | 1 |
Section I. Genetics and epigenetics annotation
 Differentially methylated gene
| Probe | Chromosome | Position | Nearest gene | P (dis) | Beta (dis) | FDR (dis) | Study |
|---|---|---|---|---|---|---|---|
| cg22985785 | 1 | 22352096 | CELA3A | 9.87E-9 | -0.012 | 4.33E-6 | DMG:Jaffe_2016 |
Section II. Transcriptome annotation
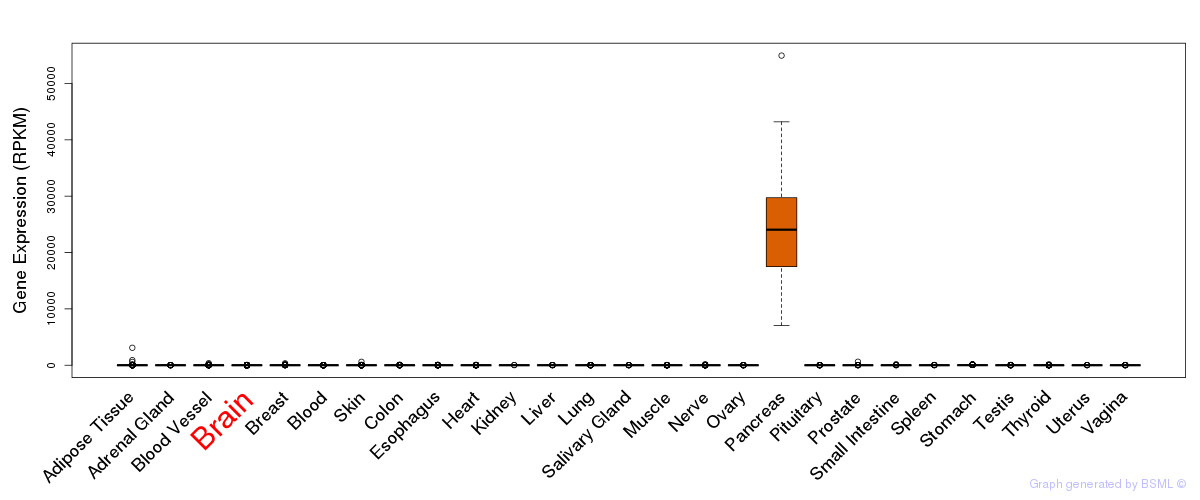
General gene expression (GTEx)
Gene expression during devlopment (BrainCloud)
Footnote:
A total of 269 time points ploted, with n=38 fetal samples (x=1:38). Each triangle represents one time point.
Gene expression of temporal and spatial changes (BrainSpan)
Footnote:
SC: sub-cortical regions; SM: sensory-motor regions; FC: frontal cortex; and TP: temporal-parietal cortex
ST1: fetal (13 - 26 postconception weeks), ST2: early infancy to late childhood (4 months to 11 years), and ST3: adolescence to adulthood (13 - 23 years)
The bar shown representes the lower 25% and upper 25% of the expression distribution.
Top co-expressed genes in brain regions
| Top 10 positively co-expressed genes | ||
| Gene | Pearson's Correlation | Spearman's Correlation |
| COMMD10 | 0.74 | 0.76 |
| CAPZA2 | 0.73 | 0.73 |
| RHEB | 0.73 | 0.74 |
| COPS4 | 0.72 | 0.73 |
| DCUN1D5 | 0.72 | 0.65 |
| ARMC10 | 0.71 | 0.70 |
| PPP2CB | 0.71 | 0.73 |
| COMMD8 | 0.71 | 0.75 |
| AC015987.1 | 0.69 | 0.74 |
| PDCD10 | 0.69 | 0.75 |
| Top 10 negatively co-expressed genes | ||
| Gene | Pearson's Correlation | Spearman's Correlation |
| AF347015.18 | -0.46 | -0.35 |
| C10orf108 | -0.43 | -0.47 |
| AF347015.26 | -0.43 | -0.32 |
| AC100783.1 | -0.41 | -0.39 |
| AC010618.2 | -0.41 | -0.42 |
| AF347015.2 | -0.41 | -0.30 |
| MICALL2 | -0.41 | -0.43 |
| MT-CYB | -0.40 | -0.32 |
| AC010300.1 | -0.40 | -0.39 |
| AF347015.8 | -0.39 | -0.31 |
Section III. Gene Ontology annotation
| Molecular function | GO term | Evidence | Neuro keywords | PubMed ID |
|---|---|---|---|---|
| GO:0004252 | serine-type endopeptidase activity | TAS | glutamate (GO term level: 7) | 2460440 |
| GO:0008233 | peptidase activity | IEA | - | |
| Biological process | GO term | Evidence | Neuro keywords | PubMed ID |
| GO:0006508 | proteolysis | TAS | 2826474 | |
| GO:0008203 | cholesterol metabolic process | TAS | 2826474 | |
| GO:0007586 | digestion | TAS | 2826474 |
Section V. Pathway annotation
| Pathway name | Pathway size | # SZGR 2.0 genes in pathway | Info |
|---|---|---|---|
| NAKAMURA CANCER MICROENVIRONMENT UP | 26 | 14 | All SZGR 2.0 genes in this pathway |
| YORDY RECIPROCAL REGULATION BY ETS1 AND SP100 DN | 87 | 48 | All SZGR 2.0 genes in this pathway |
| WEI MYCN TARGETS WITH E BOX | 795 | 478 | All SZGR 2.0 genes in this pathway |
| ROME INSULIN TARGETS IN MUSCLE DN | 204 | 114 | All SZGR 2.0 genes in this pathway |
| NABA ECM REGULATORS | 238 | 125 | All SZGR 2.0 genes in this pathway |
| NABA MATRISOME ASSOCIATED | 753 | 411 | All SZGR 2.0 genes in this pathway |
| NABA MATRISOME | 1028 | 559 | All SZGR 2.0 genes in this pathway |