Gene Page: MAEA
Summary ?
| GeneID | 10296 |
| Symbol | MAEA |
| Synonyms | EMLP|EMP|GID9|HLC-10|PIG5 |
| Description | macrophage erythroblast attacher |
| Reference | MIM:606801|HGNC:HGNC:13731|Ensembl:ENSG00000090316|HPRD:08427|Vega:OTTHUMG00000160169 |
| Gene type | protein-coding |
| Map location | 4p16.3 |
| Pascal p-value | 0.019 |
| Fetal beta | -0.01 |
| DMG | 1 (# studies) |
| eGene | Cerebellar Hemisphere Cerebellum Nucleus accumbens basal ganglia |
| Support | Ascano FMRP targets |
Gene in Data Sources
| Gene set name | Method of gene set | Description | Info |
|---|---|---|---|
| CV:PGCnp | Genome-wide Association Study | GWAS | |
| DMG:Wockner_2014 | Genome-wide DNA methylation analysis | This dataset includes 4641 differentially methylated probes corresponding to 2929 unique genes between schizophrenia patients (n=24) and controls (n=24). | 3 |
Section I. Genetics and epigenetics annotation
 Differentially methylated gene
| Probe | Chromosome | Position | Nearest gene | P (dis) | Beta (dis) | FDR (dis) | Study |
|---|---|---|---|---|---|---|---|
| cg25070192 | 4 | 1309354 | MAEA | 1.008E-4 | 0.496 | 0.028 | DMG:Wockner_2014 |
| cg23192255 | 4 | 1309340 | MAEA | 1.041E-4 | 0.883 | 0.028 | DMG:Wockner_2014 |
| cg11468319 | 4 | 1310555 | MAEA | 2.235E-4 | 0.395 | 0.036 | DMG:Wockner_2014 |
Section II. Transcriptome annotation
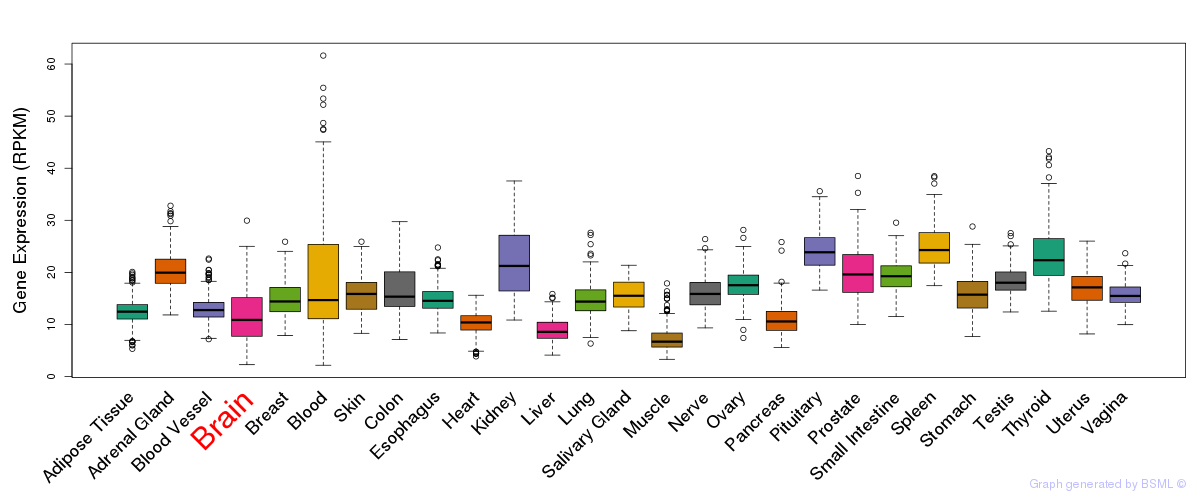
General gene expression (GTEx)
Gene expression during devlopment (BrainCloud)
Footnote:
A total of 269 time points ploted, with n=38 fetal samples (x=1:38). Each triangle represents one time point.
Gene expression of temporal and spatial changes (BrainSpan)
Footnote:
SC: sub-cortical regions; SM: sensory-motor regions; FC: frontal cortex; and TP: temporal-parietal cortex
ST1: fetal (13 - 26 postconception weeks), ST2: early infancy to late childhood (4 months to 11 years), and ST3: adolescence to adulthood (13 - 23 years)
The bar shown representes the lower 25% and upper 25% of the expression distribution.
Top co-expressed genes in brain regions
| Top 10 positively co-expressed genes | ||
| Gene | Pearson's Correlation | Spearman's Correlation |
| CEBPZ | 0.95 | 0.95 |
| SF3B1 | 0.93 | 0.94 |
| XPO1 | 0.93 | 0.91 |
| PRPF40A | 0.92 | 0.93 |
| METAP2 | 0.92 | 0.93 |
| RBM39 | 0.92 | 0.92 |
| DHX15 | 0.92 | 0.91 |
| RECQL | 0.92 | 0.92 |
| CWC22 | 0.92 | 0.91 |
| METTL14 | 0.92 | 0.89 |
| Top 10 negatively co-expressed genes | ||
| Gene | Pearson's Correlation | Spearman's Correlation |
| AF347015.31 | -0.69 | -0.83 |
| MT-CO2 | -0.69 | -0.82 |
| MT-CYB | -0.68 | -0.81 |
| AF347015.27 | -0.68 | -0.80 |
| IFI27 | -0.67 | -0.82 |
| AF347015.33 | -0.66 | -0.79 |
| AF347015.8 | -0.66 | -0.81 |
| AIFM3 | -0.66 | -0.74 |
| HLA-F | -0.66 | -0.73 |
| AF347015.15 | -0.66 | -0.80 |
Section V. Pathway annotation
| Pathway name | Pathway size | # SZGR 2.0 genes in pathway | Info |
|---|---|---|---|
| DIAZ CHRONIC MEYLOGENOUS LEUKEMIA UP | 1382 | 904 | All SZGR 2.0 genes in this pathway |
| WIKMAN ASBESTOS LUNG CANCER UP | 17 | 11 | All SZGR 2.0 genes in this pathway |
| LASTOWSKA NEUROBLASTOMA COPY NUMBER DN | 800 | 473 | All SZGR 2.0 genes in this pathway |
| NUYTTEN NIPP1 TARGETS UP | 769 | 437 | All SZGR 2.0 genes in this pathway |
| NUYTTEN EZH2 TARGETS UP | 1037 | 673 | All SZGR 2.0 genes in this pathway |
| SCIAN INVERSED TARGETS OF TP53 AND TP73 DN | 31 | 23 | All SZGR 2.0 genes in this pathway |
| BENPORATH MYC MAX TARGETS | 775 | 494 | All SZGR 2.0 genes in this pathway |
| WANG SMARCE1 TARGETS DN | 371 | 218 | All SZGR 2.0 genes in this pathway |
| STEIN ESRRA TARGETS UP | 388 | 234 | All SZGR 2.0 genes in this pathway |
| STEIN ESRRA TARGETS | 535 | 325 | All SZGR 2.0 genes in this pathway |
| DANG BOUND BY MYC | 1103 | 714 | All SZGR 2.0 genes in this pathway |
| RAO BOUND BY SALL4 ISOFORM A | 182 | 108 | All SZGR 2.0 genes in this pathway |