Gene Page: SIRPB1
Summary ?
| GeneID | 10326 |
| Symbol | SIRPB1 |
| Synonyms | CD172b|SIRP-BETA-1 |
| Description | signal regulatory protein beta 1 |
| Reference | MIM:603889|HGNC:HGNC:15928|Ensembl:ENSG00000101307|HPRD:04866|Vega:OTTHUMG00000031676 |
| Gene type | protein-coding |
| Map location | 20p13 |
| Pascal p-value | 1.18E-4 |
| Fetal beta | -0.22 |
| eGene | Cerebellum Hippocampus Hypothalamus |
Gene in Data Sources
| Gene set name | Method of gene set | Description | Info |
|---|---|---|---|
| CV:PGCnp | Genome-wide Association Study | GWAS | |
| PMID:cooccur | High-throughput literature-search | Systematic search in PubMed for genes co-occurring with SCZ keywords. A total of 3027 genes were included. | |
| Literature | High-throughput literature-search | Co-occurance with Schizophrenia keywords: schizophrenia,schizophrenic,schizophrenias | Click to show details |
Section I. Genetics and epigenetics annotation
Section II. Transcriptome annotation
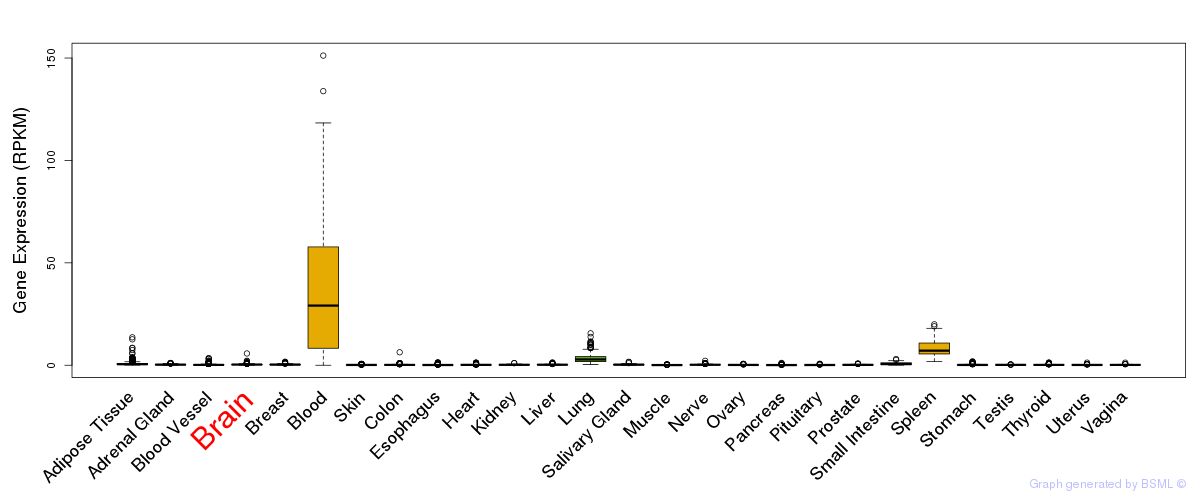
General gene expression (GTEx)
Gene expression during devlopment (BrainCloud)
Footnote:
A total of 269 time points ploted, with n=38 fetal samples (x=1:38). Each triangle represents one time point.
Gene expression of temporal and spatial changes (BrainSpan)
Footnote:
SC: sub-cortical regions; SM: sensory-motor regions; FC: frontal cortex; and TP: temporal-parietal cortex
ST1: fetal (13 - 26 postconception weeks), ST2: early infancy to late childhood (4 months to 11 years), and ST3: adolescence to adulthood (13 - 23 years)
The bar shown representes the lower 25% and upper 25% of the expression distribution.
Top co-expressed genes in brain regions
| Top 10 positively co-expressed genes | ||
| Gene | Pearson's Correlation | Spearman's Correlation |
| HSF2 | 0.95 | 0.95 |
| CNOT8 | 0.95 | 0.95 |
| NOL11 | 0.95 | 0.93 |
| CDKN2AIP | 0.95 | 0.95 |
| COPB1 | 0.95 | 0.95 |
| SF3A3 | 0.95 | 0.94 |
| CEP57 | 0.94 | 0.95 |
| PWP1 | 0.94 | 0.94 |
| NARS2 | 0.94 | 0.93 |
| CCT6A | 0.94 | 0.94 |
| Top 10 negatively co-expressed genes | ||
| Gene | Pearson's Correlation | Spearman's Correlation |
| AF347015.27 | -0.76 | -0.87 |
| MT-CO2 | -0.75 | -0.87 |
| AF347015.31 | -0.74 | -0.86 |
| AF347015.33 | -0.74 | -0.85 |
| AF347015.8 | -0.74 | -0.88 |
| MT-CYB | -0.73 | -0.86 |
| AIFM3 | -0.73 | -0.78 |
| FXYD1 | -0.72 | -0.85 |
| HLA-F | -0.72 | -0.76 |
| AF347015.15 | -0.72 | -0.86 |
Section III. Gene Ontology annotation
| Biological process | GO term | Evidence | Neuro keywords | PubMed ID |
|---|---|---|---|---|
| GO:0007166 | cell surface receptor linked signal transduction | TAS | 9062191 | |
| Cellular component | GO term | Evidence | Neuro keywords | PubMed ID |
| GO:0016020 | membrane | IEA | - | |
| GO:0016021 | integral to membrane | IEA | - | |
| GO:0005887 | integral to plasma membrane | TAS | 9062191 |
Section V. Pathway annotation
| Pathway name | Pathway size | # SZGR 2.0 genes in pathway | Info |
|---|---|---|---|
| REACTOME CELL CELL COMMUNICATION | 120 | 77 | All SZGR 2.0 genes in this pathway |
| REACTOME SIGNAL REGULATORY PROTEIN SIRP FAMILY INTERACTIONS | 12 | 10 | All SZGR 2.0 genes in this pathway |
| MULLIGHAN MLL SIGNATURE 1 UP | 380 | 236 | All SZGR 2.0 genes in this pathway |
| MULLIGHAN MLL SIGNATURE 2 UP | 418 | 263 | All SZGR 2.0 genes in this pathway |
| OUELLET CULTURED OVARIAN CANCER INVASIVE VS LMP DN | 35 | 20 | All SZGR 2.0 genes in this pathway |
| PUJANA ATM PCC NETWORK | 1442 | 892 | All SZGR 2.0 genes in this pathway |
| SATO SILENCED BY METHYLATION IN PANCREATIC CANCER 1 | 419 | 273 | All SZGR 2.0 genes in this pathway |
| GRADE COLON AND RECTAL CANCER DN | 101 | 65 | All SZGR 2.0 genes in this pathway |
| VALK AML CLUSTER 5 | 33 | 24 | All SZGR 2.0 genes in this pathway |
| PLASARI TGFB1 SIGNALING VIA NFIC 10HR DN | 30 | 25 | All SZGR 2.0 genes in this pathway |