Gene Page: BTN2A2
Summary ?
| GeneID | 10385 |
| Symbol | BTN2A2 |
| Synonyms | BT2.2|BTF2|BTN2.2 |
| Description | butyrophilin subfamily 2 member A2 |
| Reference | MIM:613591|HGNC:HGNC:1137|Ensembl:ENSG00000124508|HPRD:12545|Vega:OTTHUMG00000014452 |
| Gene type | protein-coding |
| Map location | 6p22.1 |
| Pascal p-value | 1E-12 |
| Fetal beta | -0.498 |
| eGene | Caudate basal ganglia Frontal Cortex BA9 Nucleus accumbens basal ganglia Putamen basal ganglia |
Gene in Data Sources
| Gene set name | Method of gene set | Description | Info |
|---|---|---|---|
| CV:GWASdb | Genome-wide Association Studies | GWASdb records for schizophrenia | |
| CV:PGCnp | Genome-wide Association Study | GWAS | |
| GSMA_I | Genome scan meta-analysis | Psr: 0.033 |
Section I. Genetics and epigenetics annotation
 eQTL annotation
| SNP ID | Chromosome | Position | eGene | Gene Entrez ID | pvalue | qvalue | TSS distance | eQTL type |
|---|---|---|---|---|---|---|---|---|
| rs9467728 | 6 | 26379196 | BTN2A2 | ENSG00000124508.12 | 1.591E-6 | 0.01 | -4128 | gtex_brain_putamen_basal |
| rs9467730 | 6 | 26379309 | BTN2A2 | ENSG00000124508.12 | 1.146E-7 | 0.01 | -4015 | gtex_brain_putamen_basal |
| rs9467731 | 6 | 26379358 | BTN2A2 | ENSG00000124508.12 | 1.145E-7 | 0.01 | -3966 | gtex_brain_putamen_basal |
| rs113260247 | 6 | 26379413 | BTN2A2 | ENSG00000124508.12 | 1.405E-7 | 0.01 | -3911 | gtex_brain_putamen_basal |
| rs9467733 | 6 | 26379675 | BTN2A2 | ENSG00000124508.12 | 5.066E-7 | 0.01 | -3649 | gtex_brain_putamen_basal |
| rs9467734 | 6 | 26379694 | BTN2A2 | ENSG00000124508.12 | 5.066E-7 | 0.01 | -3630 | gtex_brain_putamen_basal |
| rs9467735 | 6 | 26379814 | BTN2A2 | ENSG00000124508.12 | 1.19E-7 | 0.01 | -3510 | gtex_brain_putamen_basal |
| rs3757142 | 6 | 26380545 | BTN2A2 | ENSG00000124508.12 | 1.19E-7 | 0.01 | -2779 | gtex_brain_putamen_basal |
| rs3757144 | 6 | 26380922 | BTN2A2 | ENSG00000124508.12 | 1.19E-7 | 0.01 | -2402 | gtex_brain_putamen_basal |
| rs3757146 | 6 | 26381125 | BTN2A2 | ENSG00000124508.12 | 1.19E-7 | 0.01 | -2199 | gtex_brain_putamen_basal |
| rs3757148 | 6 | 26381206 | BTN2A2 | ENSG00000124508.12 | 1.19E-7 | 0.01 | -2118 | gtex_brain_putamen_basal |
| rs7775720 | 6 | 26381357 | BTN2A2 | ENSG00000124508.12 | 1.19E-7 | 0.01 | -1967 | gtex_brain_putamen_basal |
| rs9467738 | 6 | 26382181 | BTN2A2 | ENSG00000124508.12 | 1.19E-7 | 0.01 | -1143 | gtex_brain_putamen_basal |
| rs9467739 | 6 | 26382573 | BTN2A2 | ENSG00000124508.12 | 1.19E-7 | 0.01 | -751 | gtex_brain_putamen_basal |
| rs12208220 | 6 | 26382635 | BTN2A2 | ENSG00000124508.12 | 1.19E-7 | 0.01 | -689 | gtex_brain_putamen_basal |
| rs12189870 | 6 | 26382765 | BTN2A2 | ENSG00000124508.12 | 1.19E-7 | 0.01 | -559 | gtex_brain_putamen_basal |
| rs67924855 | 6 | 26382948 | BTN2A2 | ENSG00000124508.12 | 3.672E-7 | 0.01 | -376 | gtex_brain_putamen_basal |
| rs201931041 | 6 | 26382992 | BTN2A2 | ENSG00000124508.12 | 6.282E-7 | 0.01 | -332 | gtex_brain_putamen_basal |
| rs67857541 | 6 | 26382993 | BTN2A2 | ENSG00000124508.12 | 1.225E-7 | 0.01 | -331 | gtex_brain_putamen_basal |
| rs9467740 | 6 | 26383250 | BTN2A2 | ENSG00000124508.12 | 1.635E-6 | 0.01 | -74 | gtex_brain_putamen_basal |
| rs397840731 | 6 | 26383523 | BTN2A2 | ENSG00000124508.12 | 3.094E-6 | 0.01 | 199 | gtex_brain_putamen_basal |
| rs4490658 | 6 | 26385113 | BTN2A2 | ENSG00000124508.12 | 1.19E-7 | 0.01 | 1789 | gtex_brain_putamen_basal |
| rs61364019 | 6 | 26385170 | BTN2A2 | ENSG00000124508.12 | 6.006E-7 | 0.01 | 1846 | gtex_brain_putamen_basal |
| rs9467742 | 6 | 26386363 | BTN2A2 | ENSG00000124508.12 | 1.196E-7 | 0.01 | 3039 | gtex_brain_putamen_basal |
| rs9467743 | 6 | 26386506 | BTN2A2 | ENSG00000124508.12 | 1.19E-7 | 0.01 | 3182 | gtex_brain_putamen_basal |
| rs9467744 | 6 | 26386711 | BTN2A2 | ENSG00000124508.12 | 1.19E-7 | 0.01 | 3387 | gtex_brain_putamen_basal |
| rs9467745 | 6 | 26386762 | BTN2A2 | ENSG00000124508.12 | 1.19E-7 | 0.01 | 3438 | gtex_brain_putamen_basal |
| rs9467746 | 6 | 26387405 | BTN2A2 | ENSG00000124508.12 | 1.19E-7 | 0.01 | 4081 | gtex_brain_putamen_basal |
| rs2237233 | 6 | 26387535 | BTN2A2 | ENSG00000124508.12 | 1.19E-7 | 0.01 | 4211 | gtex_brain_putamen_basal |
| rs61032872 | 6 | 26387808 | BTN2A2 | ENSG00000124508.12 | 2.947E-7 | 0.01 | 4484 | gtex_brain_putamen_basal |
| rs9467747 | 6 | 26389072 | BTN2A2 | ENSG00000124508.12 | 1.19E-7 | 0.01 | 5748 | gtex_brain_putamen_basal |
| rs9461250 | 6 | 26389113 | BTN2A2 | ENSG00000124508.12 | 1.19E-7 | 0.01 | 5789 | gtex_brain_putamen_basal |
| rs7756881 | 6 | 26389926 | BTN2A2 | ENSG00000124508.12 | 1.19E-7 | 0.01 | 6602 | gtex_brain_putamen_basal |
| rs7757048 | 6 | 26390039 | BTN2A2 | ENSG00000124508.12 | 1.19E-7 | 0.01 | 6715 | gtex_brain_putamen_basal |
Section II. Transcriptome annotation
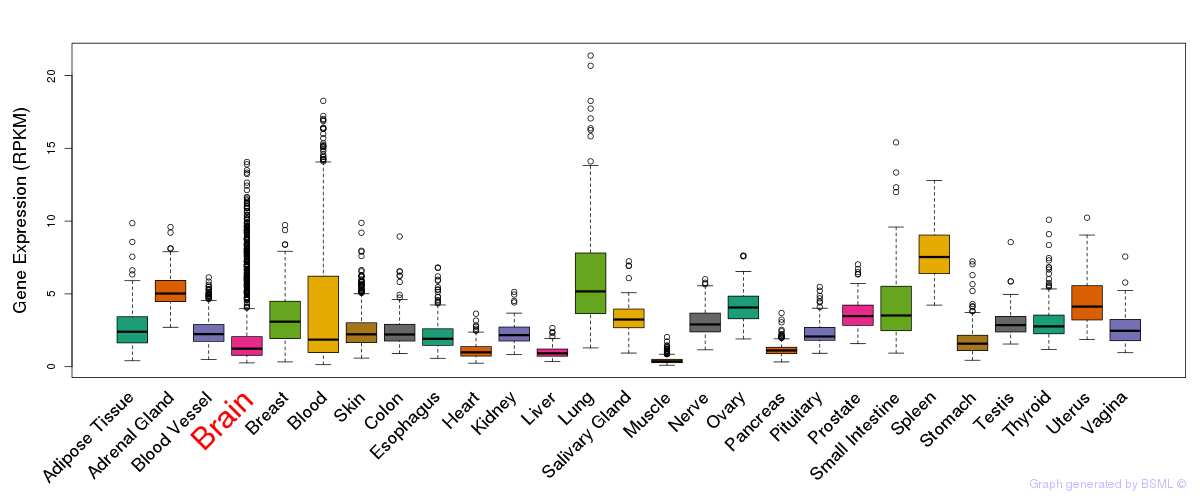
General gene expression (GTEx)
Gene expression during devlopment (BrainCloud)
Footnote:
A total of 269 time points ploted, with n=38 fetal samples (x=1:38). Each triangle represents one time point.
Gene expression of temporal and spatial changes (BrainSpan)
Footnote:
SC: sub-cortical regions; SM: sensory-motor regions; FC: frontal cortex; and TP: temporal-parietal cortex
ST1: fetal (13 - 26 postconception weeks), ST2: early infancy to late childhood (4 months to 11 years), and ST3: adolescence to adulthood (13 - 23 years)
The bar shown representes the lower 25% and upper 25% of the expression distribution.
No co-expressed genes in brain regions
Section III. Gene Ontology annotation
| Cellular component | GO term | Evidence | Neuro keywords | PubMed ID |
|---|---|---|---|---|
| GO:0016020 | membrane | IEA | - | |
| GO:0016021 | integral to membrane | IEA | - |
Section V. Pathway annotation
| Pathway name | Pathway size | # SZGR 2.0 genes in pathway | Info |
|---|---|---|---|
| MULLIGHAN NPM1 MUTATED SIGNATURE 1 DN | 126 | 86 | All SZGR 2.0 genes in this pathway |
| MULLIGHAN NPM1 MUTATED SIGNATURE 2 DN | 77 | 46 | All SZGR 2.0 genes in this pathway |
| MULLIGHAN NPM1 SIGNATURE 3 DN | 162 | 116 | All SZGR 2.0 genes in this pathway |
| ENK UV RESPONSE EPIDERMIS UP | 293 | 179 | All SZGR 2.0 genes in this pathway |
| PATIL LIVER CANCER | 747 | 453 | All SZGR 2.0 genes in this pathway |
| BUYTAERT PHOTODYNAMIC THERAPY STRESS UP | 811 | 508 | All SZGR 2.0 genes in this pathway |
| RICKMAN TUMOR DIFFERENTIATED WELL VS POORLY UP | 236 | 139 | All SZGR 2.0 genes in this pathway |
| TARTE PLASMA CELL VS PLASMABLAST UP | 398 | 262 | All SZGR 2.0 genes in this pathway |
| HELLER SILENCED BY METHYLATION UP | 282 | 183 | All SZGR 2.0 genes in this pathway |
| BEIER GLIOMA STEM CELL DN | 66 | 42 | All SZGR 2.0 genes in this pathway |
| WANG RESPONSE TO GSK3 INHIBITOR SB216763 UP | 397 | 206 | All SZGR 2.0 genes in this pathway |
| KRIEG HYPOXIA NOT VIA KDM3A | 770 | 480 | All SZGR 2.0 genes in this pathway |
| RAO BOUND BY SALL4 ISOFORM B | 517 | 302 | All SZGR 2.0 genes in this pathway |