Gene Page: FRS3
Summary ?
| GeneID | 10817 |
| Symbol | FRS3 |
| Synonyms | FRS2-beta|FRS2B|FRS2beta|SNT-2|SNT2 |
| Description | fibroblast growth factor receptor substrate 3 |
| Reference | MIM:607744|HGNC:HGNC:16970|Ensembl:ENSG00000137218|HPRD:06373|Vega:OTTHUMG00000014686 |
| Gene type | protein-coding |
| Map location | 6p21.1 |
| Pascal p-value | 0.09 |
| Sherlock p-value | 0.569 |
| Fetal beta | -0.11 |
| DMG | 1 (# studies) |
| eGene | Cerebellar Hemisphere Cerebellum |
Gene in Data Sources
| Gene set name | Method of gene set | Description | Info |
|---|---|---|---|
| CV:PGCnp | Genome-wide Association Study | GWAS | |
| DMG:Jaffe_2016 | Genome-wide DNA methylation analysis | This dataset includes 2,104 probes/CpGs associated with SZ patients (n=108) compared to 136 controls at Bonferroni-adjusted P < 0.05. | 1 |
| GSMA_I | Genome scan meta-analysis | Psr: 0.033 | |
| GSMA_IIE | Genome scan meta-analysis (European-ancestry samples) | Psr: 0.04433 |
Section I. Genetics and epigenetics annotation
 Differentially methylated gene
| Probe | Chromosome | Position | Nearest gene | P (dis) | Beta (dis) | FDR (dis) | Study |
|---|---|---|---|---|---|---|---|
| cg07967643 | 6 | 41747785 | FRS3 | 2.76E-9 | -0.012 | 1.97E-6 | DMG:Jaffe_2016 |
Section II. Transcriptome annotation
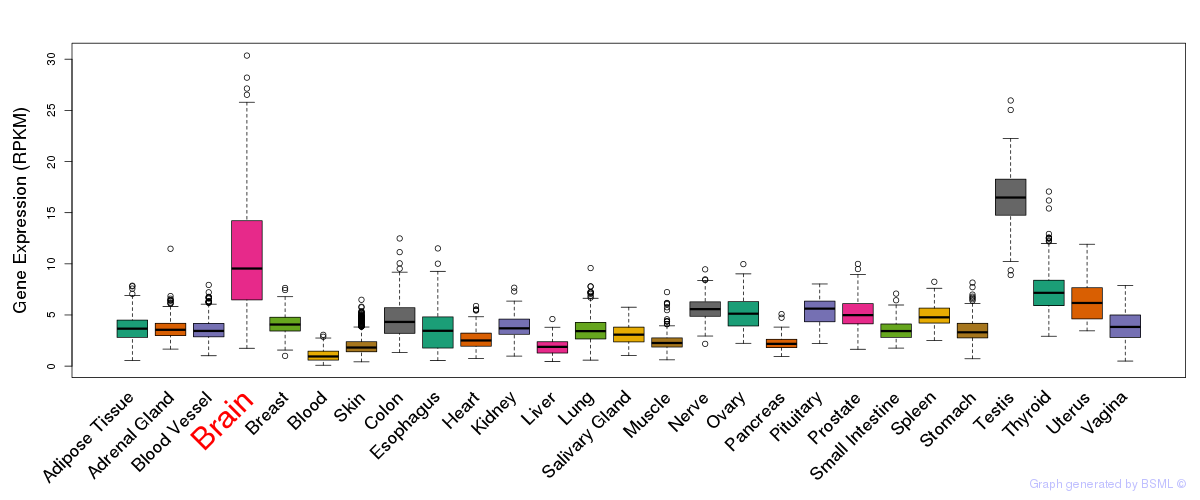
General gene expression (GTEx)

Gene expression during devlopment (BrainCloud)
Footnote:
A total of 269 time points ploted, with n=38 fetal samples (x=1:38). Each triangle represents one time point.
Gene expression of temporal and spatial changes (BrainSpan)
Footnote:
SC: sub-cortical regions; SM: sensory-motor regions; FC: frontal cortex; and TP: temporal-parietal cortex
ST1: fetal (13 - 26 postconception weeks), ST2: early infancy to late childhood (4 months to 11 years), and ST3: adolescence to adulthood (13 - 23 years)
The bar shown representes the lower 25% and upper 25% of the expression distribution.
Top co-expressed genes in brain regions
| Top 10 positively co-expressed genes | ||
| Gene | Pearson's Correlation | Spearman's Correlation |
| LSMD1 | 0.93 | 0.81 |
| NDUFA2 | 0.92 | 0.84 |
| NDUFB7 | 0.91 | 0.83 |
| ZNHIT1 | 0.90 | 0.77 |
| C19orf70 | 0.90 | 0.78 |
| GUK1 | 0.89 | 0.74 |
| MRPL54 | 0.89 | 0.76 |
| TIMM8B | 0.89 | 0.72 |
| NDUFA13 | 0.89 | 0.83 |
| C7orf59 | 0.89 | 0.73 |
| Top 10 negatively co-expressed genes | ||
| Gene | Pearson's Correlation | Spearman's Correlation |
| KIF16B | -0.52 | -0.62 |
| FNBP1 | -0.50 | -0.60 |
| UPF2 | -0.50 | -0.49 |
| GOLGB1 | -0.50 | -0.55 |
| SOS2 | -0.49 | -0.54 |
| DYNC1LI2 | -0.49 | -0.42 |
| AC005035.1 | -0.49 | -0.59 |
| ZC3H13 | -0.49 | -0.53 |
| GOLGA4 | -0.49 | -0.55 |
| MDN1 | -0.48 | -0.52 |
Section III. Gene Ontology annotation
| Molecular function | GO term | Evidence | Neuro keywords | PubMed ID |
|---|---|---|---|---|
| GO:0005158 | insulin receptor binding | IEA | - | |
| Biological process | GO term | Evidence | Neuro keywords | PubMed ID |
| GO:0007165 | signal transduction | TAS | 8761293 | |
| GO:0008543 | fibroblast growth factor receptor signaling pathway | TAS | 8761293 | |
| Cellular component | GO term | Evidence | Neuro keywords | PubMed ID |
| GO:0016020 | membrane | IEA | - |
Section V. Pathway annotation
| Pathway name | Pathway size | # SZGR 2.0 genes in pathway | Info |
|---|---|---|---|
| PID SHP2 PATHWAY | 58 | 46 | All SZGR 2.0 genes in this pathway |
| PID TRKR PATHWAY | 62 | 48 | All SZGR 2.0 genes in this pathway |
| REACTOME SIGNALING BY FGFR IN DISEASE | 127 | 88 | All SZGR 2.0 genes in this pathway |
| REACTOME FRS2 MEDIATED CASCADE | 36 | 27 | All SZGR 2.0 genes in this pathway |
| REACTOME DOWNSTREAM SIGNALING OF ACTIVATED FGFR | 100 | 74 | All SZGR 2.0 genes in this pathway |
| REACTOME SIGNALING BY FGFR | 112 | 80 | All SZGR 2.0 genes in this pathway |
| GRAESSMANN APOPTOSIS BY DOXORUBICIN DN | 1781 | 1082 | All SZGR 2.0 genes in this pathway |
| ACEVEDO LIVER CANCER UP | 973 | 570 | All SZGR 2.0 genes in this pathway |
| ACEVEDO LIVER TUMOR VS NORMAL ADJACENT TISSUE UP | 863 | 514 | All SZGR 2.0 genes in this pathway |
| VART KSHV INFECTION ANGIOGENIC MARKERS DN | 138 | 92 | All SZGR 2.0 genes in this pathway |
| RATTENBACHER BOUND BY CELF1 | 467 | 251 | All SZGR 2.0 genes in this pathway |
Section VI. microRNA annotation
| miRNA family | Target position | miRNA ID | miRNA seq | ||
|---|---|---|---|---|---|
| UTR start | UTR end | Match method | |||
| miR-128 | 239 | 245 | 1A | hsa-miR-128a | UCACAGUGAACCGGUCUCUUUU |
| hsa-miR-128b | UCACAGUGAACCGGUCUCUUUC | ||||
| miR-27 | 239 | 246 | 1A,m8 | hsa-miR-27abrain | UUCACAGUGGCUAAGUUCCGC |
| hsa-miR-27bbrain | UUCACAGUGGCUAAGUUCUGC | ||||
| miR-544 | 101 | 107 | m8 | hsa-miR-544 | AUUCUGCAUUUUUAGCAAGU |
- SZ: miRNAs which differentially expressed in brain cortex of schizophrenia patients comparing with control samples using microarray. Click here to see the list of SZ related miRNAs.
- Brain: miRNAs which are expressed in brain based on miRNA microarray expression studies. Click here to see the list of brain related miRNAs.