Gene Page: TREH
Summary ?
| GeneID | 11181 |
| Symbol | TREH |
| Synonyms | TRE|TREA |
| Description | trehalase |
| Reference | MIM:275360|HGNC:HGNC:12266|Ensembl:ENSG00000118094|HPRD:02038|Vega:OTTHUMG00000166409 |
| Gene type | protein-coding |
| Map location | 11q23.3 |
| Pascal p-value | 0.152 |
| eGene | Myers' cis & trans |
Gene in Data Sources
| Gene set name | Method of gene set | Description | Info |
|---|---|---|---|
| CV:PGCnp | Genome-wide Association Study | GWAS | |
| CV:PheWAS | Phenome-wide association studies (PheWAS) | 157 SNPs associated with schizophrenia | 0 |
| GSMA_I | Genome scan meta-analysis | Psr: 0.006 |
Section I. Genetics and epigenetics annotation
 CV:PheWAS
| SNP ID | Chromosome | Position | Allele | P | Function | Gene | Up/Down Distance |
|---|
eQTL annotation
| SNP ID | Chromosome | Position | eGene | Gene Entrez ID | pvalue | qvalue | TSS distance | eQTL type |
|---|---|---|---|---|---|---|---|---|
| rs1940245 | chr9 | 113522916 | TREH | 11181 | 0.17 | trans |
Section II. Transcriptome annotation
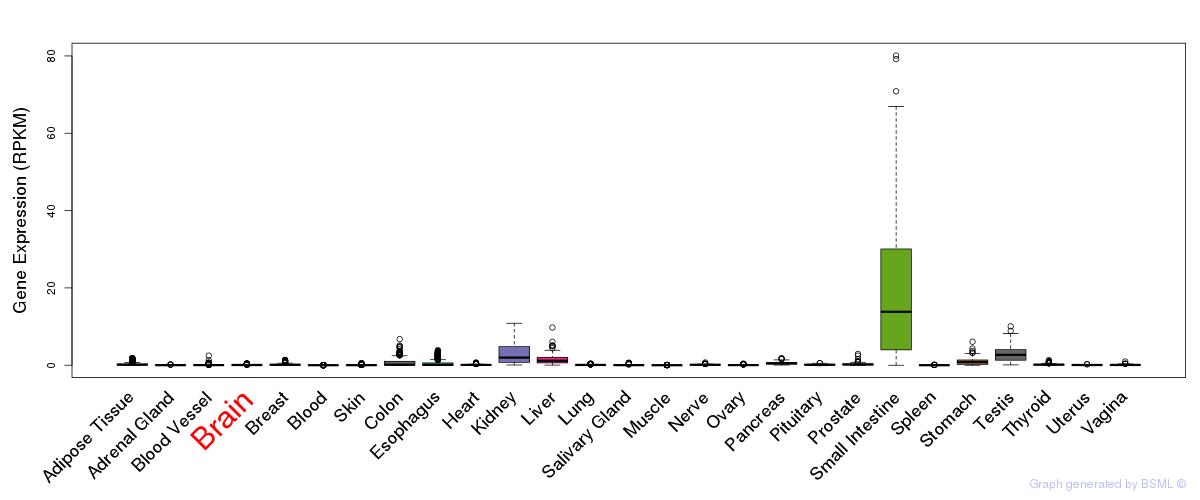
General gene expression (GTEx)
Gene expression of temporal and spatial changes (BrainSpan)
Footnote:
SC: sub-cortical regions; SM: sensory-motor regions; FC: frontal cortex; and TP: temporal-parietal cortex
ST1: fetal (13 - 26 postconception weeks), ST2: early infancy to late childhood (4 months to 11 years), and ST3: adolescence to adulthood (13 - 23 years)
The bar shown representes the lower 25% and upper 25% of the expression distribution.
Top co-expressed genes in brain regions
| Top 10 positively co-expressed genes | ||
| Gene | Pearson's Correlation | Spearman's Correlation |
| CAMK2A | 0.95 | 0.95 |
| CAMTA2 | 0.95 | 0.89 |
| PACSIN1 | 0.95 | 0.93 |
| MAST3 | 0.94 | 0.88 |
| AC105206.1 | 0.93 | 0.85 |
| DGKZ | 0.93 | 0.90 |
| MFSD4 | 0.93 | 0.92 |
| EXTL1 | 0.93 | 0.93 |
| SLC17A7 | 0.93 | 0.76 |
| TEF | 0.92 | 0.85 |
| Top 10 negatively co-expressed genes | ||
| Gene | Pearson's Correlation | Spearman's Correlation |
| BCL7C | -0.58 | -0.68 |
| TUBB2B | -0.56 | -0.61 |
| KIAA1949 | -0.56 | -0.53 |
| TRAF4 | -0.56 | -0.65 |
| DYNLT1 | -0.55 | -0.72 |
| C9orf46 | -0.54 | -0.64 |
| PPP1R14B | -0.54 | -0.65 |
| SH3BP2 | -0.54 | -0.57 |
| RPL23A | -0.54 | -0.65 |
| PDE9A | -0.54 | -0.59 |
Section III. Gene Ontology annotation
| Molecular function | GO term | Evidence | Neuro keywords | PubMed ID |
|---|---|---|---|---|
| GO:0004555 | alpha,alpha-trehalase activity | IDA | 8773341 | |
| GO:0016798 | hydrolase activity, acting on glycosyl bonds | IEA | - | |
| Biological process | GO term | Evidence | Neuro keywords | PubMed ID |
| GO:0005993 | trehalose catabolic process | TAS | 9427547 | |
| GO:0008152 | metabolic process | IEA | - | |
| Cellular component | GO term | Evidence | Neuro keywords | PubMed ID |
| GO:0005886 | plasma membrane | TAS | 9427547 | |
| GO:0046658 | anchored to plasma membrane | TAS | 8773341 |
Section V. Pathway annotation
| Pathway name | Pathway size | # SZGR 2.0 genes in pathway | Info |
|---|---|---|---|
| KEGG STARCH AND SUCROSE METABOLISM | 52 | 33 | All SZGR 2.0 genes in this pathway |
| BIOCARTA FEEDER PATHWAY | 9 | 8 | All SZGR 2.0 genes in this pathway |
| REACTOME METABOLISM OF CARBOHYDRATES | 247 | 154 | All SZGR 2.0 genes in this pathway |
| MULLIGHAN MLL SIGNATURE 1 DN | 242 | 165 | All SZGR 2.0 genes in this pathway |
| YAUCH HEDGEHOG SIGNALING PARACRINE DN | 264 | 159 | All SZGR 2.0 genes in this pathway |
| YOSHIMURA MAPK8 TARGETS UP | 1305 | 895 | All SZGR 2.0 genes in this pathway |
| CHEN METABOLIC SYNDROM NETWORK | 1210 | 725 | All SZGR 2.0 genes in this pathway |
| PURBEY TARGETS OF CTBP1 AND SATB1 DN | 180 | 116 | All SZGR 2.0 genes in this pathway |