Gene Page: CLK3
Summary ?
| GeneID | 1198 |
| Symbol | CLK3 |
| Synonyms | PHCLK3|PHCLK3/152 |
| Description | CDC like kinase 3 |
| Reference | MIM:602990|HGNC:HGNC:2071|Ensembl:ENSG00000179335|HPRD:04290|Vega:OTTHUMG00000141320 |
| Gene type | protein-coding |
| Map location | 15q24 |
| Pascal p-value | 0.881 |
| Sherlock p-value | 0.572 |
| Fetal beta | 0.64 |
| DMG | 1 (# studies) |
Gene in Data Sources
| Gene set name | Method of gene set | Description | Info |
|---|---|---|---|
| DMG:Jaffe_2016 | Genome-wide DNA methylation analysis | This dataset includes 2,104 probes/CpGs associated with SZ patients (n=108) compared to 136 controls at Bonferroni-adjusted P < 0.05. | 1 |
Section I. Genetics and epigenetics annotation
 Differentially methylated gene
| Probe | Chromosome | Position | Nearest gene | P (dis) | Beta (dis) | FDR (dis) | Study |
|---|---|---|---|---|---|---|---|
| cg17038108 | 15 | 74907587 | CLK3 | 3.35E-9 | -0.008 | 2.22E-6 | DMG:Jaffe_2016 |
Section II. Transcriptome annotation
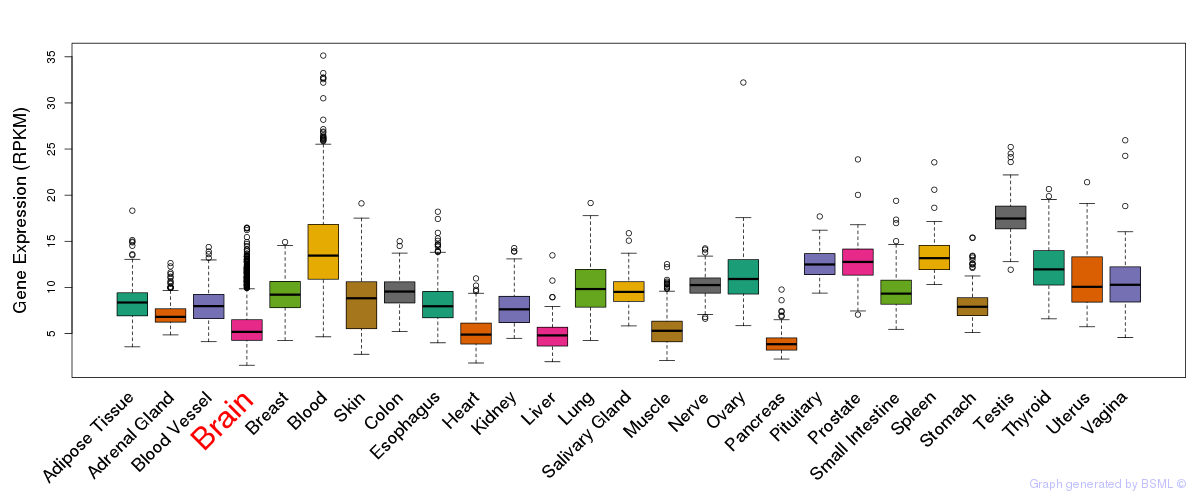
General gene expression (GTEx)
Gene expression during devlopment (BrainCloud)
Footnote:
A total of 269 time points ploted, with n=38 fetal samples (x=1:38). Each triangle represents one time point.
Gene expression of temporal and spatial changes (BrainSpan)
Footnote:
SC: sub-cortical regions; SM: sensory-motor regions; FC: frontal cortex; and TP: temporal-parietal cortex
ST1: fetal (13 - 26 postconception weeks), ST2: early infancy to late childhood (4 months to 11 years), and ST3: adolescence to adulthood (13 - 23 years)
The bar shown representes the lower 25% and upper 25% of the expression distribution.
Top co-expressed genes in brain regions
| Top 10 positively co-expressed genes | ||
| Gene | Pearson's Correlation | Spearman's Correlation |
| ADH5 | 0.90 | 0.85 |
| DHX40 | 0.89 | 0.81 |
| ACTL6A | 0.88 | 0.75 |
| RRM1 | 0.87 | 0.81 |
| ARL6IP6 | 0.87 | 0.74 |
| CPSF3 | 0.87 | 0.81 |
| E2F5 | 0.86 | 0.76 |
| HBP1 | 0.86 | 0.80 |
| RYK | 0.86 | 0.81 |
| HNRNPF | 0.86 | 0.79 |
| Top 10 negatively co-expressed genes | ||
| Gene | Pearson's Correlation | Spearman's Correlation |
| AF347015.27 | -0.59 | -0.70 |
| MT-CO2 | -0.58 | -0.68 |
| AF347015.8 | -0.58 | -0.68 |
| AF347015.33 | -0.56 | -0.66 |
| MT-CYB | -0.55 | -0.66 |
| AF347015.21 | -0.55 | -0.68 |
| AF347015.15 | -0.55 | -0.67 |
| AF347015.31 | -0.54 | -0.66 |
| AF347015.26 | -0.52 | -0.66 |
| AF347015.2 | -0.52 | -0.66 |
Section V. Pathway annotation
| Pathway name | Pathway size | # SZGR 2.0 genes in pathway | Info |
|---|---|---|---|
| GINESTIER BREAST CANCER 20Q13 AMPLIFICATION DN | 180 | 101 | All SZGR 2.0 genes in this pathway |
| LINDGREN BLADDER CANCER CLUSTER 3 DN | 229 | 142 | All SZGR 2.0 genes in this pathway |
| PEREZ TP53 TARGETS | 1174 | 695 | All SZGR 2.0 genes in this pathway |
| DACOSTA UV RESPONSE VIA ERCC3 UP | 309 | 199 | All SZGR 2.0 genes in this pathway |
| RICKMAN METASTASIS DN | 261 | 155 | All SZGR 2.0 genes in this pathway |
| MENSE HYPOXIA UP | 98 | 71 | All SZGR 2.0 genes in this pathway |
| DEBIASI APOPTOSIS BY REOVIRUS INFECTION UP | 314 | 201 | All SZGR 2.0 genes in this pathway |
| WANG CISPLATIN RESPONSE AND XPC DN | 228 | 146 | All SZGR 2.0 genes in this pathway |
| DACOSTA UV RESPONSE VIA ERCC3 COMMON UP | 77 | 47 | All SZGR 2.0 genes in this pathway |
| CHENG IMPRINTED BY ESTRADIOL | 110 | 68 | All SZGR 2.0 genes in this pathway |
| MITSIADES RESPONSE TO APLIDIN UP | 439 | 257 | All SZGR 2.0 genes in this pathway |
| DUAN PRDM5 TARGETS | 79 | 52 | All SZGR 2.0 genes in this pathway |
| PURBEY TARGETS OF CTBP1 NOT SATB1 DN | 448 | 282 | All SZGR 2.0 genes in this pathway |
| KRIEG HYPOXIA NOT VIA KDM3A | 770 | 480 | All SZGR 2.0 genes in this pathway |