Gene Page: CLDND2
Summary ?
| GeneID | 125875 |
| Symbol | CLDND2 |
| Synonyms | - |
| Description | claudin domain containing 2 |
| Reference | HGNC:HGNC:28511|Ensembl:ENSG00000160318|HPRD:14574|Vega:OTTHUMG00000182901 |
| Gene type | protein-coding |
| Map location | 19q13.41 |
| Pascal p-value | 0.17 |
| Sherlock p-value | 1.703E-4 |
| Fetal beta | -0.261 |
| DMG | 1 (# studies) |
| eGene | Myers' cis & trans |
Gene in Data Sources
| Gene set name | Method of gene set | Description | Info |
|---|---|---|---|
| DMG:vanEijk_2014 | Genome-wide DNA methylation analysis | This dataset includes 432 differentially methylated CpG sites corresponding to 391 unique transcripts between schizophrenia patients (n=260) and unaffected controls (n=250). | 5 |
Section I. Genetics and epigenetics annotation
 Differentially methylated gene
| Probe | Chromosome | Position | Nearest gene | P (dis) | Beta (dis) | FDR (dis) | Study |
|---|---|---|---|---|---|---|---|
| cg16293105 | 19 | 52034970 | CLDND2 | 3.416E-4 | 9.585 | DMG:vanEijk_2014 | |
| cg08818784 | 19 | 56562184-56562207 | CLDND2 | 1.166E-4 | 9.03 | DMG:vanEijk_2014 | |
| cg12491710 | 19 | 51891526 | CLDND2 | 0.001 | -5.257 | DMG:vanEijk_2014 | |
| cg13407883 | 19 | 51627843 | CLDND2 | 0.001 | -9.88 | DMG:vanEijk_2014 | |
| cg14496375 | 19 | 51872365 | CLDND2 | 2.13E-7 | -12.935 | DMG:vanEijk_2014 |
eQTL annotation
| SNP ID | Chromosome | Position | eGene | Gene Entrez ID | pvalue | qvalue | TSS distance | eQTL type |
|---|---|---|---|---|---|---|---|---|
| rs1990542 | chr2 | 59380755 | CLDND2 | 125875 | 0.1 | trans | ||
| rs17082952 | chr4 | 63704150 | CLDND2 | 125875 | 0.08 | trans | ||
| rs17140817 | chr7 | 69161094 | CLDND2 | 125875 | 0.18 | trans | ||
| rs10256512 | chr7 | 69179729 | CLDND2 | 125875 | 0.18 | trans | ||
| rs10230356 | chr7 | 69259612 | CLDND2 | 125875 | 0.18 | trans | ||
| rs2029585 | chr12 | 100442386 | CLDND2 | 125875 | 0.15 | trans | ||
| rs10498563 | chr14 | 83962834 | CLDND2 | 125875 | 0.1 | trans | ||
| rs9615635 | chr22 | 48181619 | CLDND2 | 125875 | 0.17 | trans | ||
| rs12840601 | chrX | 90356935 | CLDND2 | 125875 | 0.02 | trans |
Section II. Transcriptome annotation
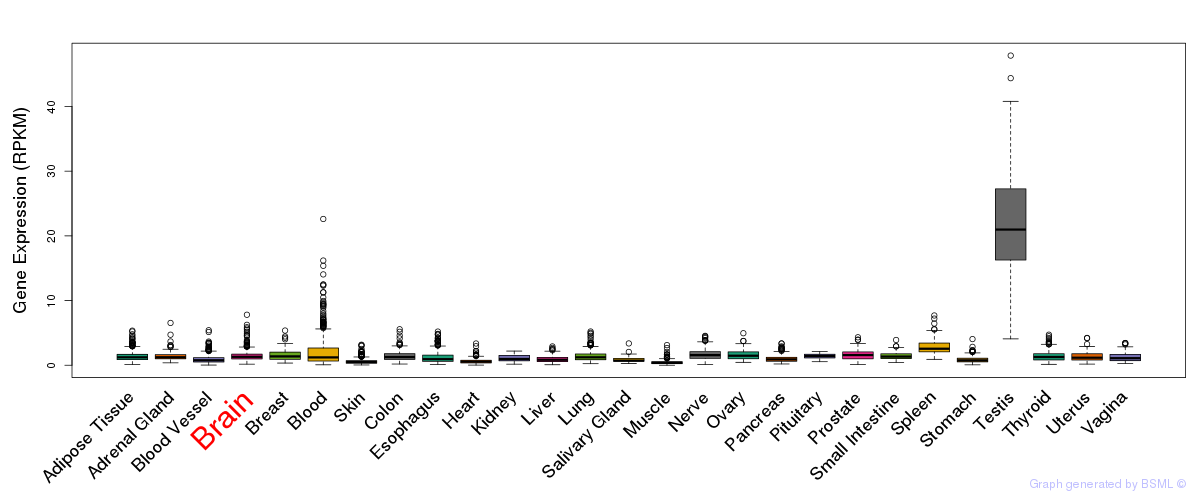
General gene expression (GTEx)
Gene expression during devlopment (BrainCloud)
Footnote:
A total of 269 time points ploted, with n=38 fetal samples (x=1:38). Each triangle represents one time point.
Gene expression of temporal and spatial changes (BrainSpan)
Footnote:
SC: sub-cortical regions; SM: sensory-motor regions; FC: frontal cortex; and TP: temporal-parietal cortex
ST1: fetal (13 - 26 postconception weeks), ST2: early infancy to late childhood (4 months to 11 years), and ST3: adolescence to adulthood (13 - 23 years)
The bar shown representes the lower 25% and upper 25% of the expression distribution.
No co-expressed genes in brain regions
Section V. Pathway annotation
| Pathway name | Pathway size | # SZGR 2.0 genes in pathway | Info |
|---|---|---|---|
| BRUECKNER TARGETS OF MIRLET7A3 UP | 111 | 69 | All SZGR 2.0 genes in this pathway |
| MIKKELSEN ES ICP WITH H3K4ME3 | 718 | 401 | All SZGR 2.0 genes in this pathway |
| LU EZH2 TARGETS UP | 295 | 155 | All SZGR 2.0 genes in this pathway |
| FIGUEROA AML METHYLATION CLUSTER 5 DN | 50 | 31 | All SZGR 2.0 genes in this pathway |