Gene Page: AGA
Summary ?
| GeneID | 175 |
| Symbol | AGA |
| Synonyms | AGU|ASRG|GA |
| Description | aspartylglucosaminidase |
| Reference | MIM:613228|HGNC:HGNC:318|Ensembl:ENSG00000038002|HPRD:01949|Vega:OTTHUMG00000160723 |
| Gene type | protein-coding |
| Map location | 4q34.3 |
| Pascal p-value | 0.343 |
| Sherlock p-value | 0.434 |
| Fetal beta | -1.042 |
| DMG | 2 (# studies) |
| eGene | Anterior cingulate cortex BA24 Caudate basal ganglia Cerebellar Hemisphere Cerebellum Cortex Frontal Cortex BA9 Hippocampus Hypothalamus Nucleus accumbens basal ganglia Putamen basal ganglia Myers' cis & trans Meta |
Gene in Data Sources
| Gene set name | Method of gene set | Description | Info |
|---|---|---|---|
| CV:PGCnp | Genome-wide Association Study | GWAS | |
| DMG:Nishioka_2013 | Genome-wide DNA methylation analysis | The authors investigated the methylation profiles of DNA in peripheral blood cells from 18 patients with first-episode schizophrenia (FESZ) and from 15 normal controls. | 2 |
| DMG:vanEijk_2014 | Genome-wide DNA methylation analysis | This dataset includes 432 differentially methylated CpG sites corresponding to 391 unique transcripts between schizophrenia patients (n=260) and unaffected controls (n=250). | 2 |
| PMID:cooccur | High-throughput literature-search | Systematic search in PubMed for genes co-occurring with SCZ keywords. A total of 3027 genes were included. | |
| Literature | High-throughput literature-search | Co-occurance with Schizophrenia keywords: schizophrenia,schizophrenic,schizophrenics,schizophrenias | Click to show details |
Section I. Genetics and epigenetics annotation
 Differentially methylated gene
| Probe | Chromosome | Position | Nearest gene | P (dis) | Beta (dis) | FDR (dis) | Study |
|---|---|---|---|---|---|---|---|
| cg21521452 | 4 | 178600548 | AGA | -0.038 | 0.25 | DMG:Nishioka_2013 | |
| cg21521452 | 4 | 178588987-178589036 | AGA | 0.037 | -2.491 | DMG:vanEijk_2014 |
eQTL annotation
| SNP ID | Chromosome | Position | eGene | Gene Entrez ID | pvalue | qvalue | TSS distance | eQTL type |
|---|---|---|---|---|---|---|---|---|
| rs2271101 | chr4 | 178359718 | AGA | 175 | 0.02 | cis | ||
| rs1105059 | 4 | 178356461 | AGA | ENSG00000038002.4 | 1.137E-6 | 0.02 | 7196 | gtex_brain_ba24 |
| rs13149149 | 4 | 178360550 | AGA | ENSG00000038002.4 | 3.781E-7 | 0.02 | 3107 | gtex_brain_ba24 |
| rs4690522 | 4 | 178361051 | AGA | ENSG00000038002.4 | 4.123E-7 | 0.02 | 2606 | gtex_brain_ba24 |
| rs13133517 | 4 | 178361987 | AGA | ENSG00000038002.4 | 4.123E-7 | 0.02 | 1670 | gtex_brain_ba24 |
| rs13106192 | 4 | 178362122 | AGA | ENSG00000038002.4 | 3.753E-7 | 0.02 | 1535 | gtex_brain_ba24 |
| rs11131799 | 4 | 178363378 | AGA | ENSG00000038002.4 | 1.381E-6 | 0.02 | 279 | gtex_brain_ba24 |
| rs1105059 | 4 | 178356461 | AGA | ENSG00000038002.4 | 3.931E-10 | 0 | 7196 | gtex_brain_putamen_basal |
| rs2271101 | 4 | 178359719 | AGA | ENSG00000038002.4 | 8.903E-9 | 0 | 3938 | gtex_brain_putamen_basal |
| rs13149149 | 4 | 178360550 | AGA | ENSG00000038002.4 | 3.029E-11 | 0 | 3107 | gtex_brain_putamen_basal |
| rs4690522 | 4 | 178361051 | AGA | ENSG00000038002.4 | 1.456E-10 | 0 | 2606 | gtex_brain_putamen_basal |
| rs4690523 | 4 | 178361162 | AGA | ENSG00000038002.4 | 7.887E-9 | 0 | 2495 | gtex_brain_putamen_basal |
| rs13133517 | 4 | 178361987 | AGA | ENSG00000038002.4 | 1.456E-10 | 0 | 1670 | gtex_brain_putamen_basal |
| rs13106192 | 4 | 178362122 | AGA | ENSG00000038002.4 | 2.848E-11 | 0 | 1535 | gtex_brain_putamen_basal |
| rs11131799 | 4 | 178363378 | AGA | ENSG00000038002.4 | 7.301E-10 | 0 | 279 | gtex_brain_putamen_basal |
Section II. Transcriptome annotation
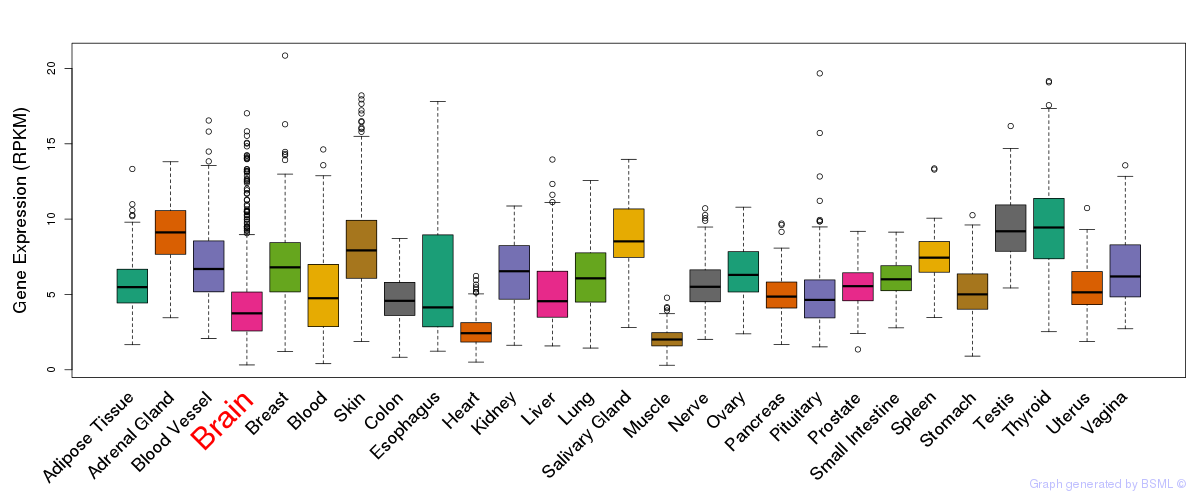
General gene expression (GTEx)
Gene expression during devlopment (BrainCloud)
Footnote:
A total of 269 time points ploted, with n=38 fetal samples (x=1:38). Each triangle represents one time point.
Gene expression of temporal and spatial changes (BrainSpan)
Footnote:
SC: sub-cortical regions; SM: sensory-motor regions; FC: frontal cortex; and TP: temporal-parietal cortex
ST1: fetal (13 - 26 postconception weeks), ST2: early infancy to late childhood (4 months to 11 years), and ST3: adolescence to adulthood (13 - 23 years)
The bar shown representes the lower 25% and upper 25% of the expression distribution.
Top co-expressed genes in brain regions
| Top 10 positively co-expressed genes | ||
| Gene | Pearson's Correlation | Spearman's Correlation |
| ZNF770 | 0.92 | 0.94 |
| C3orf63 | 0.91 | 0.93 |
| PIK3CA | 0.91 | 0.93 |
| IBTK | 0.90 | 0.92 |
| STAM2 | 0.90 | 0.92 |
| LMAN1 | 0.89 | 0.93 |
| RNGTT | 0.89 | 0.91 |
| CAMSAP1L1 | 0.89 | 0.91 |
| C5orf51 | 0.89 | 0.91 |
| ADAM10 | 0.89 | 0.92 |
| Top 10 negatively co-expressed genes | ||
| Gene | Pearson's Correlation | Spearman's Correlation |
| MT-CO2 | -0.68 | -0.78 |
| AF347015.31 | -0.67 | -0.76 |
| FXYD1 | -0.65 | -0.72 |
| AF347015.33 | -0.65 | -0.71 |
| IFI27 | -0.64 | -0.72 |
| HIGD1B | -0.64 | -0.74 |
| AF347015.21 | -0.64 | -0.75 |
| AF347015.8 | -0.64 | -0.74 |
| MT-CYB | -0.64 | -0.72 |
| AF347015.27 | -0.63 | -0.71 |
Section V. Pathway annotation
| Pathway name | Pathway size | # SZGR 2.0 genes in pathway | Info |
|---|---|---|---|
| KEGG OTHER GLYCAN DEGRADATION | 16 | 12 | All SZGR 2.0 genes in this pathway |
| KEGG LYSOSOME | 121 | 83 | All SZGR 2.0 genes in this pathway |
| DEURIG T CELL PROLYMPHOCYTIC LEUKEMIA UP | 368 | 234 | All SZGR 2.0 genes in this pathway |
| LIU CMYB TARGETS UP | 165 | 106 | All SZGR 2.0 genes in this pathway |
| LIU VMYB TARGETS UP | 127 | 78 | All SZGR 2.0 genes in this pathway |
| ROZANOV MMP14 TARGETS DN | 35 | 22 | All SZGR 2.0 genes in this pathway |
| TARTE PLASMA CELL VS B LYMPHOCYTE UP | 78 | 51 | All SZGR 2.0 genes in this pathway |
| XU GH1 AUTOCRINE TARGETS UP | 268 | 157 | All SZGR 2.0 genes in this pathway |
| KRIGE RESPONSE TO TOSEDOSTAT 6HR UP | 953 | 554 | All SZGR 2.0 genes in this pathway |
| KRIGE RESPONSE TO TOSEDOSTAT 24HR UP | 783 | 442 | All SZGR 2.0 genes in this pathway |
| IZADPANAH STEM CELL ADIPOSE VS BONE UP | 126 | 92 | All SZGR 2.0 genes in this pathway |
| BOYAULT LIVER CANCER SUBCLASS G3 UP | 188 | 121 | All SZGR 2.0 genes in this pathway |
| ZHAN MULTIPLE MYELOMA HP DN | 47 | 23 | All SZGR 2.0 genes in this pathway |
| CHICAS RB1 TARGETS CONFLUENT | 567 | 365 | All SZGR 2.0 genes in this pathway |
| BRUINS UVC RESPONSE VIA TP53 GROUP B | 549 | 316 | All SZGR 2.0 genes in this pathway |
| KATSANOU ELAVL1 TARGETS UP | 169 | 105 | All SZGR 2.0 genes in this pathway |