Gene Page: MEGF8
Summary ?
| GeneID | 1954 |
| Symbol | MEGF8 |
| Synonyms | C19orf49|CRPT2|EGFL4|SBP1 |
| Description | multiple EGF like domains 8 |
| Reference | MIM:604267|HGNC:HGNC:3233|Ensembl:ENSG00000105429|HPRD:10370|Vega:OTTHUMG00000150342 |
| Gene type | protein-coding |
| Map location | 19q12 |
| Pascal p-value | 0.03 |
| Sherlock p-value | 0.789 |
| Fetal beta | -0.388 |
| DMG | 1 (# studies) |
| Support | Ascano FMRP targets |
Gene in Data Sources
| Gene set name | Method of gene set | Description | Info |
|---|---|---|---|
| CV:PGCnp | Genome-wide Association Study | GWAS | |
| DMG:Jaffe_2016 | Genome-wide DNA methylation analysis | This dataset includes 2,104 probes/CpGs associated with SZ patients (n=108) compared to 136 controls at Bonferroni-adjusted P < 0.05. | 1 |
Section I. Genetics and epigenetics annotation
 Differentially methylated gene
| Probe | Chromosome | Position | Nearest gene | P (dis) | Beta (dis) | FDR (dis) | Study |
|---|---|---|---|---|---|---|---|
| cg00712136 | 19 | 42829564 | MEGF8 | 1.26E-8 | -0.022 | 5.1E-6 | DMG:Jaffe_2016 |
Section II. Transcriptome annotation
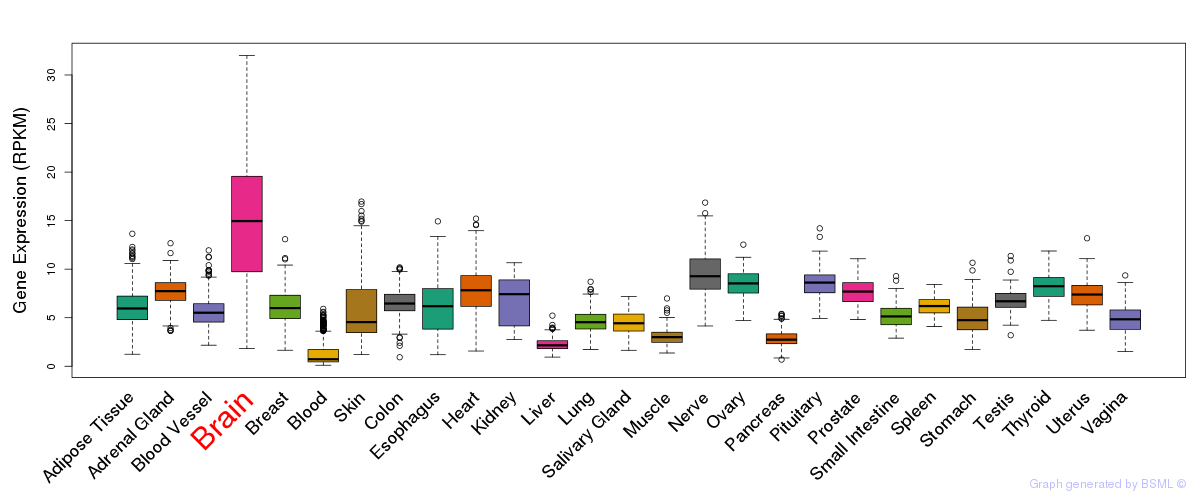
General gene expression (GTEx)
Gene expression during devlopment (BrainCloud)
Footnote:
A total of 269 time points ploted, with n=38 fetal samples (x=1:38). Each triangle represents one time point.
Gene expression of temporal and spatial changes (BrainSpan)
Footnote:
SC: sub-cortical regions; SM: sensory-motor regions; FC: frontal cortex; and TP: temporal-parietal cortex
ST1: fetal (13 - 26 postconception weeks), ST2: early infancy to late childhood (4 months to 11 years), and ST3: adolescence to adulthood (13 - 23 years)
The bar shown representes the lower 25% and upper 25% of the expression distribution.
Top co-expressed genes in brain regions
| Top 10 positively co-expressed genes | ||
| Gene | Pearson's Correlation | Spearman's Correlation |
| ERCC3 | 0.93 | 0.93 |
| KIAA0406 | 0.92 | 0.92 |
| KIAA0174 | 0.92 | 0.91 |
| RNPS1 | 0.91 | 0.92 |
| SMYD5 | 0.91 | 0.92 |
| PRPSAP1 | 0.91 | 0.92 |
| WDR5 | 0.91 | 0.91 |
| TBP | 0.91 | 0.91 |
| QRICH1 | 0.91 | 0.92 |
| BRD8 | 0.91 | 0.92 |
| Top 10 negatively co-expressed genes | ||
| Gene | Pearson's Correlation | Spearman's Correlation |
| AF347015.31 | -0.84 | -0.87 |
| MT-CO2 | -0.83 | -0.86 |
| AF347015.27 | -0.83 | -0.86 |
| AF347015.8 | -0.81 | -0.86 |
| MT-CYB | -0.81 | -0.84 |
| AF347015.33 | -0.79 | -0.82 |
| AF347015.21 | -0.79 | -0.88 |
| AF347015.15 | -0.78 | -0.84 |
| AF347015.2 | -0.77 | -0.83 |
| IFI27 | -0.75 | -0.80 |
Section V. Pathway annotation
| Pathway name | Pathway size | # SZGR 2.0 genes in pathway | Info |
|---|---|---|---|
| SCHLOSSER SERUM RESPONSE DN | 712 | 443 | All SZGR 2.0 genes in this pathway |
| LU AGING BRAIN DN | 153 | 120 | All SZGR 2.0 genes in this pathway |
| BROWNE HCMV INFECTION 18HR DN | 178 | 121 | All SZGR 2.0 genes in this pathway |
| GRADE COLON CANCER UP | 871 | 505 | All SZGR 2.0 genes in this pathway |
| CHANG CORE SERUM RESPONSE DN | 209 | 137 | All SZGR 2.0 genes in this pathway |
| VERHAAK GLIOBLASTOMA CLASSICAL | 162 | 122 | All SZGR 2.0 genes in this pathway |
| FORTSCHEGGER PHF8 TARGETS DN | 784 | 464 | All SZGR 2.0 genes in this pathway |
| NABA SECRETED FACTORS | 344 | 197 | All SZGR 2.0 genes in this pathway |
| NABA MATRISOME ASSOCIATED | 753 | 411 | All SZGR 2.0 genes in this pathway |
| NABA MATRISOME | 1028 | 559 | All SZGR 2.0 genes in this pathway |