Gene Page: KDM4B
Summary ?
| GeneID | 23030 |
| Symbol | KDM4B |
| Synonyms | JMJD2B|TDRD14B |
| Description | lysine demethylase 4B |
| Reference | MIM:609765|HGNC:HGNC:29136|Ensembl:ENSG00000127663|HPRD:11056|Vega:OTTHUMG00000180281 |
| Gene type | protein-coding |
| Map location | 19p13.3 |
| Pascal p-value | 0.025 |
| Sherlock p-value | 0.667 |
| Fetal beta | 1.353 |
| DMG | 1 (# studies) |
| eGene | Myers' cis & trans |
| Support | CompositeSet Darnell FMRP targets Ascano FMRP targets Chromatin Remodeling Genes |
Gene in Data Sources
| Gene set name | Method of gene set | Description | Info |
|---|---|---|---|
| CV:PGCnp | Genome-wide Association Study | GWAS | |
| DMG:Wockner_2014 | Genome-wide DNA methylation analysis | This dataset includes 4641 differentially methylated probes corresponding to 2929 unique genes between schizophrenia patients (n=24) and controls (n=24). | 1 |
Section I. Genetics and epigenetics annotation
 Differentially methylated gene
| Probe | Chromosome | Position | Nearest gene | P (dis) | Beta (dis) | FDR (dis) | Study |
|---|---|---|---|---|---|---|---|
| cg24450508 | 19 | 5141352 | KDM4B | 1.855E-4 | 0.523 | 0.034 | DMG:Wockner_2014 |
eQTL annotation
| SNP ID | Chromosome | Position | eGene | Gene Entrez ID | pvalue | qvalue | TSS distance | eQTL type |
|---|---|---|---|---|---|---|---|---|
| rs1368303 | chr5 | 147672388 | KDM4B | 23030 | 0 | trans | ||
| rs968370 | chr8 | 4053046 | KDM4B | 23030 | 0.17 | trans | ||
| rs1902408 | chr10 | 33873360 | KDM4B | 23030 | 0.18 | trans | ||
| rs17104720 | chr14 | 77127308 | KDM4B | 23030 | 0.08 | trans | ||
| rs16955618 | chr15 | 29937543 | KDM4B | 23030 | 0.01 | trans |
Section II. Transcriptome annotation
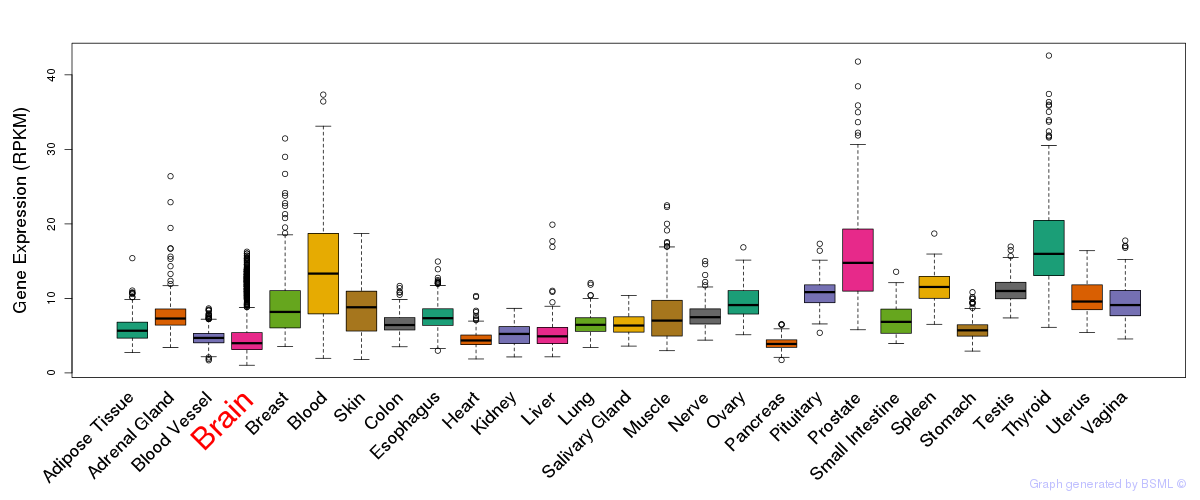
General gene expression (GTEx)
Gene expression during devlopment (BrainCloud)
Footnote:
A total of 269 time points ploted, with n=38 fetal samples (x=1:38). Each triangle represents one time point.
Gene expression of temporal and spatial changes (BrainSpan)
Footnote:
SC: sub-cortical regions; SM: sensory-motor regions; FC: frontal cortex; and TP: temporal-parietal cortex
ST1: fetal (13 - 26 postconception weeks), ST2: early infancy to late childhood (4 months to 11 years), and ST3: adolescence to adulthood (13 - 23 years)
The bar shown representes the lower 25% and upper 25% of the expression distribution.
Top co-expressed genes in brain regions
| Top 10 positively co-expressed genes | ||
| Gene | Pearson's Correlation | Spearman's Correlation |
| INTS3 | 0.89 | 0.91 |
| ZNF862 | 0.86 | 0.88 |
| ARHGAP17 | 0.85 | 0.84 |
| WDR59 | 0.85 | 0.89 |
| SETD5 | 0.84 | 0.87 |
| TTLL5 | 0.84 | 0.86 |
| SLC46A1 | 0.84 | 0.86 |
| GOLGA1 | 0.84 | 0.85 |
| ODF2 | 0.84 | 0.88 |
| COG7 | 0.84 | 0.85 |
| Top 10 negatively co-expressed genes | ||
| Gene | Pearson's Correlation | Spearman's Correlation |
| AF347015.31 | -0.71 | -0.77 |
| MT-CO2 | -0.70 | -0.77 |
| AF347015.27 | -0.69 | -0.75 |
| AF347015.21 | -0.66 | -0.79 |
| AF347015.8 | -0.66 | -0.75 |
| AF347015.33 | -0.65 | -0.71 |
| MT-CYB | -0.65 | -0.72 |
| HIGD1B | -0.62 | -0.71 |
| AF347015.2 | -0.62 | -0.74 |
| IFI27 | -0.62 | -0.68 |
Section III. Gene Ontology annotation
| Molecular function | GO term | Evidence | Neuro keywords | PubMed ID |
|---|---|---|---|---|
| GO:0003676 | nucleic acid binding | IEA | - | |
| GO:0005506 | iron ion binding | IEA | - | |
| GO:0005515 | protein binding | IEA | - | |
| GO:0008270 | zinc ion binding | IEA | - | |
| GO:0016702 | oxidoreductase activity, acting on single donors with incorporation of molecular oxygen, incorporation of two atoms of oxygen | IEA | - | |
| GO:0016491 | oxidoreductase activity | IEA | - | |
| GO:0046872 | metal ion binding | IEA | - | |
| Biological process | GO term | Evidence | Neuro keywords | PubMed ID |
| GO:0006355 | regulation of transcription, DNA-dependent | IEA | - | |
| GO:0006350 | transcription | IEA | - | |
| GO:0016568 | chromatin modification | IEA | - | |
| GO:0055114 | oxidation reduction | IEA | - | |
| Cellular component | GO term | Evidence | Neuro keywords | PubMed ID |
| GO:0005634 | nucleus | IEA | - |
Section V. Pathway annotation
| Pathway name | Pathway size | # SZGR 2.0 genes in pathway | Info |
|---|---|---|---|
| PARENT MTOR SIGNALING UP | 567 | 375 | All SZGR 2.0 genes in this pathway |
| NAKAMURA TUMOR ZONE PERIPHERAL VS CENTRAL DN | 634 | 384 | All SZGR 2.0 genes in this pathway |
| GAZDA DIAMOND BLACKFAN ANEMIA ERYTHROID DN | 493 | 298 | All SZGR 2.0 genes in this pathway |
| GARY CD5 TARGETS UP | 473 | 314 | All SZGR 2.0 genes in this pathway |
| CHARAFE BREAST CANCER LUMINAL VS BASAL UP | 380 | 215 | All SZGR 2.0 genes in this pathway |
| DOANE RESPONSE TO ANDROGEN UP | 184 | 125 | All SZGR 2.0 genes in this pathway |
| BASAKI YBX1 TARGETS DN | 384 | 230 | All SZGR 2.0 genes in this pathway |
| OSWALD HEMATOPOIETIC STEM CELL IN COLLAGEN GEL UP | 233 | 161 | All SZGR 2.0 genes in this pathway |
| ELVIDGE HYPOXIA UP | 171 | 112 | All SZGR 2.0 genes in this pathway |
| ELVIDGE HIF1A TARGETS DN | 91 | 58 | All SZGR 2.0 genes in this pathway |
| ELVIDGE HIF1A AND HIF2A TARGETS DN | 104 | 72 | All SZGR 2.0 genes in this pathway |
| RODRIGUES THYROID CARCINOMA POORLY DIFFERENTIATED DN | 805 | 505 | All SZGR 2.0 genes in this pathway |
| GRAESSMANN APOPTOSIS BY DOXORUBICIN DN | 1781 | 1082 | All SZGR 2.0 genes in this pathway |
| PEREZ TP53 TARGETS | 1174 | 695 | All SZGR 2.0 genes in this pathway |
| FARMER BREAST CANCER APOCRINE VS BASAL | 330 | 217 | All SZGR 2.0 genes in this pathway |
| FARMER BREAST CANCER BASAL VS LULMINAL | 330 | 215 | All SZGR 2.0 genes in this pathway |
| SCHLOSSER SERUM RESPONSE UP | 134 | 93 | All SZGR 2.0 genes in this pathway |
| YANG BREAST CANCER ESR1 UP | 36 | 22 | All SZGR 2.0 genes in this pathway |
| BUYTAERT PHOTODYNAMIC THERAPY STRESS UP | 811 | 508 | All SZGR 2.0 genes in this pathway |
| ROSS ACUTE MYELOID LEUKEMIA CBF | 82 | 57 | All SZGR 2.0 genes in this pathway |
| PENG RAPAMYCIN RESPONSE UP | 203 | 130 | All SZGR 2.0 genes in this pathway |
| ROSS AML WITH AML1 ETO FUSION | 76 | 55 | All SZGR 2.0 genes in this pathway |
| MENSE HYPOXIA UP | 98 | 71 | All SZGR 2.0 genes in this pathway |
| KIM GASTRIC CANCER CHEMOSENSITIVITY | 103 | 64 | All SZGR 2.0 genes in this pathway |
| MARTINEZ RESPONSE TO TRABECTEDIN DN | 271 | 175 | All SZGR 2.0 genes in this pathway |
| BILD E2F3 ONCOGENIC SIGNATURE | 246 | 153 | All SZGR 2.0 genes in this pathway |
| BILD SRC ONCOGENIC SIGNATURE | 62 | 38 | All SZGR 2.0 genes in this pathway |
| BILD CTNNB1 ONCOGENIC SIGNATURE | 82 | 52 | All SZGR 2.0 genes in this pathway |
| MASSARWEH TAMOXIFEN RESISTANCE DN | 258 | 160 | All SZGR 2.0 genes in this pathway |
| OUILLETTE CLL 13Q14 DELETION UP | 74 | 40 | All SZGR 2.0 genes in this pathway |
| SMID BREAST CANCER RELAPSE IN BRAIN DN | 85 | 58 | All SZGR 2.0 genes in this pathway |
| SMID BREAST CANCER LUMINAL B UP | 172 | 109 | All SZGR 2.0 genes in this pathway |
| SMID BREAST CANCER BASAL DN | 701 | 446 | All SZGR 2.0 genes in this pathway |
| WEST ADRENOCORTICAL TUMOR UP | 294 | 199 | All SZGR 2.0 genes in this pathway |
| BOHN PRIMARY IMMUNODEFICIENCY SYNDROM DN | 40 | 31 | All SZGR 2.0 genes in this pathway |
| VANTVEER BREAST CANCER ESR1 UP | 167 | 99 | All SZGR 2.0 genes in this pathway |
| SHEDDEN LUNG CANCER GOOD SURVIVAL A5 | 70 | 32 | All SZGR 2.0 genes in this pathway |
| VALK AML CLUSTER 13 | 30 | 20 | All SZGR 2.0 genes in this pathway |
| POOLA INVASIVE BREAST CANCER DN | 134 | 83 | All SZGR 2.0 genes in this pathway |
| YAGI AML WITH T 8 21 TRANSLOCATION | 368 | 247 | All SZGR 2.0 genes in this pathway |
| QI HYPOXIA | 140 | 96 | All SZGR 2.0 genes in this pathway |
| FIGUEROA AML METHYLATION CLUSTER 1 DN | 48 | 30 | All SZGR 2.0 genes in this pathway |
| FIGUEROA AML METHYLATION CLUSTER 3 DN | 42 | 24 | All SZGR 2.0 genes in this pathway |
| BHAT ESR1 TARGETS NOT VIA AKT1 UP | 211 | 131 | All SZGR 2.0 genes in this pathway |
| BHAT ESR1 TARGETS VIA AKT1 UP | 281 | 183 | All SZGR 2.0 genes in this pathway |
| BRUINS UVC RESPONSE VIA TP53 GROUP A | 898 | 516 | All SZGR 2.0 genes in this pathway |
| FOSTER KDM1A TARGETS DN | 211 | 119 | All SZGR 2.0 genes in this pathway |
| HOLLEMAN VINCRISTINE RESISTANCE B ALL UP | 38 | 22 | All SZGR 2.0 genes in this pathway |
| HOLLEMAN VINCRISTINE RESISTANCE ALL UP | 27 | 16 | All SZGR 2.0 genes in this pathway |