Gene Page: SIRT3
Summary ?
| GeneID | 23410 |
| Symbol | SIRT3 |
| Synonyms | SIR2L3 |
| Description | sirtuin 3 |
| Reference | MIM:604481|HGNC:HGNC:14931|Ensembl:ENSG00000142082|HPRD:06836|Vega:OTTHUMG00000119074 |
| Gene type | protein-coding |
| Map location | 11p15.5 |
| Pascal p-value | 0.967 |
| Sherlock p-value | 0.165 |
| Fetal beta | -0.946 |
| DMG | 1 (# studies) |
| eGene | Caudate basal ganglia Cerebellum Nucleus accumbens basal ganglia Myers' cis & trans Meta |
Gene in Data Sources
| Gene set name | Method of gene set | Description | Info |
|---|---|---|---|
| DMG:Jaffe_2016 | Genome-wide DNA methylation analysis | This dataset includes 2,104 probes/CpGs associated with SZ patients (n=108) compared to 136 controls at Bonferroni-adjusted P < 0.05. | 1 |
Section I. Genetics and epigenetics annotation
 Differentially methylated gene
| Probe | Chromosome | Position | Nearest gene | P (dis) | Beta (dis) | FDR (dis) | Study |
|---|---|---|---|---|---|---|---|
| cg22718774 | 11 | 236527 | SIRT3 | 3.94E-8 | -0.009 | 1.12E-5 | DMG:Jaffe_2016 |
eQTL annotation
| SNP ID | Chromosome | Position | eGene | Gene Entrez ID | pvalue | qvalue | TSS distance | eQTL type |
|---|---|---|---|---|---|---|---|---|
| rs2179782 | chr6 | 37588562 | SIRT3 | 23410 | 0.11 | trans | ||
| rs1129271 | chr7 | 102087201 | SIRT3 | 23410 | 0.08 | trans |
Section II. Transcriptome annotation
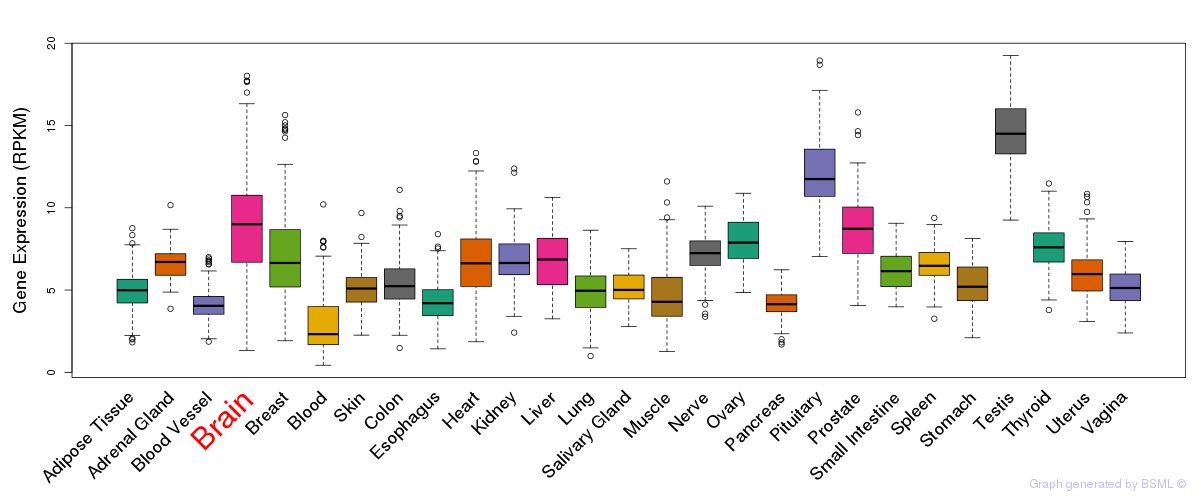
General gene expression (GTEx)
Gene expression during devlopment (BrainCloud)
Footnote:
A total of 269 time points ploted, with n=38 fetal samples (x=1:38). Each triangle represents one time point.
Gene expression of temporal and spatial changes (BrainSpan)
Footnote:
SC: sub-cortical regions; SM: sensory-motor regions; FC: frontal cortex; and TP: temporal-parietal cortex
ST1: fetal (13 - 26 postconception weeks), ST2: early infancy to late childhood (4 months to 11 years), and ST3: adolescence to adulthood (13 - 23 years)
The bar shown representes the lower 25% and upper 25% of the expression distribution.
Top co-expressed genes in brain regions
| Top 10 positively co-expressed genes | ||
| Gene | Pearson's Correlation | Spearman's Correlation |
| SLC4A4 | 0.82 | 0.82 |
| AQP4 | 0.81 | 0.70 |
| CYBRD1 | 0.80 | 0.77 |
| ADD3 | 0.80 | 0.79 |
| TLR4 | 0.80 | 0.77 |
| ITGAV | 0.79 | 0.69 |
| FGF2 | 0.79 | 0.74 |
| SSPN | 0.79 | 0.79 |
| PDLIM5 | 0.77 | 0.79 |
| BMPR1B | 0.77 | 0.68 |
| Top 10 negatively co-expressed genes | ||
| Gene | Pearson's Correlation | Spearman's Correlation |
| RP9 | -0.31 | -0.48 |
| CCDC107 | -0.31 | -0.44 |
| ZNF32 | -0.31 | -0.52 |
| NR2C2AP | -0.30 | -0.46 |
| FAM128A | -0.30 | -0.44 |
| SNHG12 | -0.30 | -0.48 |
| C7orf40 | -0.30 | -0.38 |
| AC011491.1 | -0.30 | -0.41 |
| ATF4 | -0.30 | -0.41 |
| RPAIN | -0.30 | -0.43 |
Section V. Pathway annotation
| Pathway name | Pathway size | # SZGR 2.0 genes in pathway | Info |
|---|---|---|---|
| PID HDAC CLASSIII PATHWAY | 25 | 20 | All SZGR 2.0 genes in this pathway |
| PID HDAC CLASSI PATHWAY | 66 | 50 | All SZGR 2.0 genes in this pathway |
| PARENT MTOR SIGNALING UP | 567 | 375 | All SZGR 2.0 genes in this pathway |
| SOTIRIOU BREAST CANCER GRADE 1 VS 3 DN | 52 | 34 | All SZGR 2.0 genes in this pathway |
| YANG BREAST CANCER ESR1 LASER UP | 34 | 25 | All SZGR 2.0 genes in this pathway |
| SHETH LIVER CANCER VS TXNIP LOSS PAM4 | 261 | 153 | All SZGR 2.0 genes in this pathway |
| BYSTRYKH HEMATOPOIESIS STEM CELL QTL TRANS | 882 | 572 | All SZGR 2.0 genes in this pathway |
| MANALO HYPOXIA UP | 207 | 145 | All SZGR 2.0 genes in this pathway |
| IVANOVA HEMATOPOIESIS EARLY PROGENITOR | 532 | 309 | All SZGR 2.0 genes in this pathway |
| MODY HIPPOCAMPUS POSTNATAL | 63 | 50 | All SZGR 2.0 genes in this pathway |
| BLALOCK ALZHEIMERS DISEASE DN | 1237 | 837 | All SZGR 2.0 genes in this pathway |
| TSENG IRS1 TARGETS DN | 135 | 88 | All SZGR 2.0 genes in this pathway |
| CHANG IMMORTALIZED BY HPV31 UP | 84 | 55 | All SZGR 2.0 genes in this pathway |
| BONOME OVARIAN CANCER SURVIVAL OPTIMAL DEBULKING | 246 | 152 | All SZGR 2.0 genes in this pathway |
| WANG TUMOR INVASIVENESS DN | 210 | 128 | All SZGR 2.0 genes in this pathway |
| SHAFFER IRF4 TARGETS IN ACTIVATED DENDRITIC CELL | 65 | 49 | All SZGR 2.0 genes in this pathway |
| WONG ADULT TISSUE STEM MODULE | 721 | 492 | All SZGR 2.0 genes in this pathway |
| LI INDUCED T TO NATURAL KILLER UP | 307 | 182 | All SZGR 2.0 genes in this pathway |
| GUO TARGETS OF IRS1 AND IRS2 | 98 | 67 | All SZGR 2.0 genes in this pathway |