Gene Page: G6PC
Summary ?
| GeneID | 2538 |
| Symbol | G6PC |
| Synonyms | G6PC1|G6PT|GSD1|GSD1a |
| Description | glucose-6-phosphatase catalytic subunit |
| Reference | MIM:613742|HGNC:HGNC:4056|HPRD:01983| |
| Gene type | protein-coding |
| Map location | 17q21 |
| Pascal p-value | 0.368 |
| DMG | 1 (# studies) |
Gene in Data Sources
| Gene set name | Method of gene set | Description | Info |
|---|---|---|---|
| CV:PGCnp | Genome-wide Association Study | GWAS | |
| DMG:Wockner_2014 | Genome-wide DNA methylation analysis | This dataset includes 4641 differentially methylated probes corresponding to 2929 unique genes between schizophrenia patients (n=24) and controls (n=24). | 1 |
Section I. Genetics and epigenetics annotation
 Differentially methylated gene
| Probe | Chromosome | Position | Nearest gene | P (dis) | Beta (dis) | FDR (dis) | Study |
|---|---|---|---|---|---|---|---|
| cg26673195 | 17 | 41052729 | G6PC | 4.08E-5 | -0.587 | 0.02 | DMG:Wockner_2014 |
Section II. Transcriptome annotation
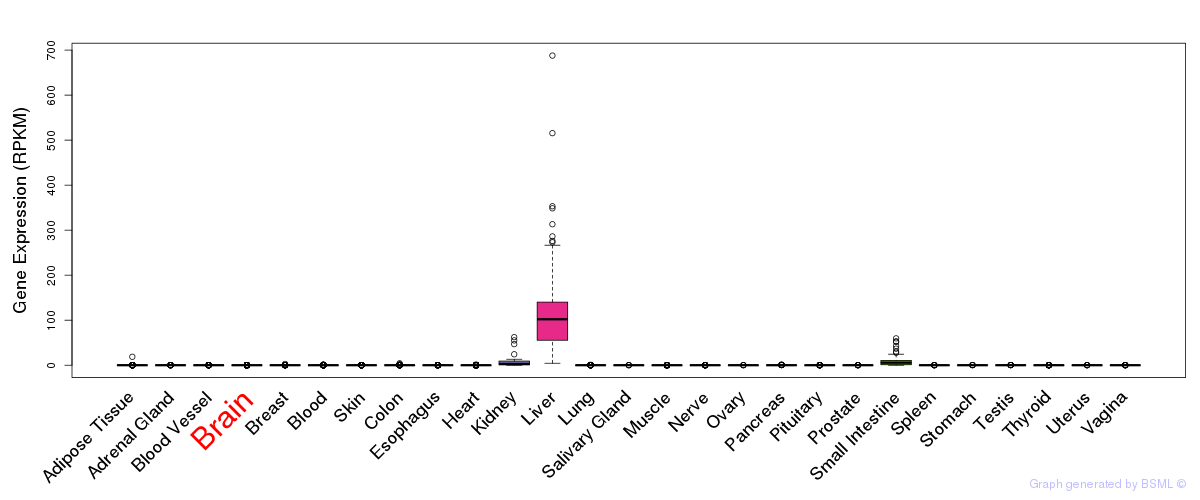
General gene expression (GTEx)
Gene expression during devlopment (BrainCloud)
Footnote:
A total of 269 time points ploted, with n=38 fetal samples (x=1:38). Each triangle represents one time point.
Gene expression of temporal and spatial changes (BrainSpan)
Footnote:
SC: sub-cortical regions; SM: sensory-motor regions; FC: frontal cortex; and TP: temporal-parietal cortex
ST1: fetal (13 - 26 postconception weeks), ST2: early infancy to late childhood (4 months to 11 years), and ST3: adolescence to adulthood (13 - 23 years)
The bar shown representes the lower 25% and upper 25% of the expression distribution.
Top co-expressed genes in brain regions
| Top 10 positively co-expressed genes | ||
| Gene | Pearson's Correlation | Spearman's Correlation |
| B4GALT6 | 0.94 | 0.86 |
| OXR1 | 0.94 | 0.90 |
| SLC4A10 | 0.93 | 0.87 |
| GLS | 0.93 | 0.82 |
| EFR3A | 0.93 | 0.85 |
| NSF | 0.93 | 0.87 |
| IPCEF1 | 0.93 | 0.80 |
| GABRB2 | 0.93 | 0.88 |
| HLF | 0.92 | 0.88 |
| ZNF365 | 0.92 | 0.90 |
| Top 10 negatively co-expressed genes | ||
| Gene | Pearson's Correlation | Spearman's Correlation |
| BCL7C | -0.53 | -0.60 |
| FADS2 | -0.52 | -0.44 |
| SEMA4B | -0.49 | -0.43 |
| NME4 | -0.48 | -0.61 |
| GPR125 | -0.48 | -0.42 |
| TRAF4 | -0.48 | -0.53 |
| SH3BP2 | -0.47 | -0.54 |
| PDE9A | -0.47 | -0.50 |
| CDC42EP4 | -0.46 | -0.40 |
| RPL23A | -0.46 | -0.52 |
Section V. Pathway annotation
| Pathway name | Pathway size | # SZGR 2.0 genes in pathway | Info |
|---|---|---|---|
| KEGG GLYCOLYSIS GLUCONEOGENESIS | 62 | 41 | All SZGR 2.0 genes in this pathway |
| KEGG GALACTOSE METABOLISM | 26 | 22 | All SZGR 2.0 genes in this pathway |
| KEGG STARCH AND SUCROSE METABOLISM | 52 | 33 | All SZGR 2.0 genes in this pathway |
| KEGG INSULIN SIGNALING PATHWAY | 137 | 103 | All SZGR 2.0 genes in this pathway |
| KEGG ADIPOCYTOKINE SIGNALING PATHWAY | 67 | 57 | All SZGR 2.0 genes in this pathway |
| PID HNF3B PATHWAY | 45 | 37 | All SZGR 2.0 genes in this pathway |
| PID FOXO PATHWAY | 49 | 43 | All SZGR 2.0 genes in this pathway |
| REACTOME TRANSMEMBRANE TRANSPORT OF SMALL MOLECULES | 413 | 270 | All SZGR 2.0 genes in this pathway |
| REACTOME SLC MEDIATED TRANSMEMBRANE TRANSPORT | 241 | 157 | All SZGR 2.0 genes in this pathway |
| REACTOME GLUCOSE TRANSPORT | 38 | 29 | All SZGR 2.0 genes in this pathway |
| REACTOME METABOLISM OF CARBOHYDRATES | 247 | 154 | All SZGR 2.0 genes in this pathway |
| SHETH LIVER CANCER VS TXNIP LOSS PAM4 | 261 | 153 | All SZGR 2.0 genes in this pathway |
| LEE LIVER CANCER CIPROFIBRATE DN | 66 | 43 | All SZGR 2.0 genes in this pathway |
| LEE LIVER CANCER MYC TGFA DN | 65 | 44 | All SZGR 2.0 genes in this pathway |
| LEE LIVER CANCER ACOX1 DN | 65 | 39 | All SZGR 2.0 genes in this pathway |
| LEE LIVER CANCER MYC E2F1 DN | 64 | 38 | All SZGR 2.0 genes in this pathway |
| LEE LIVER CANCER DENA DN | 74 | 45 | All SZGR 2.0 genes in this pathway |
| LEE LIVER CANCER MYC DN | 63 | 40 | All SZGR 2.0 genes in this pathway |
| FLECHNER BIOPSY KIDNEY TRANSPLANT REJECTED VS OK DN | 546 | 351 | All SZGR 2.0 genes in this pathway |
| SANSOM APC TARGETS DN | 366 | 238 | All SZGR 2.0 genes in this pathway |
| HSIAO LIVER SPECIFIC GENES | 244 | 154 | All SZGR 2.0 genes in this pathway |
| JOSEPH RESPONSE TO SODIUM BUTYRATE DN | 64 | 45 | All SZGR 2.0 genes in this pathway |
| LEE AGING CEREBELLUM DN | 86 | 66 | All SZGR 2.0 genes in this pathway |
| WANG CISPLATIN RESPONSE AND XPC UP | 202 | 115 | All SZGR 2.0 genes in this pathway |
| LEE LIVER CANCER SURVIVAL UP | 185 | 112 | All SZGR 2.0 genes in this pathway |
| ICHIBA GRAFT VERSUS HOST DISEASE D7 DN | 40 | 22 | All SZGR 2.0 genes in this pathway |
| ICHIBA GRAFT VERSUS HOST DISEASE 35D DN | 49 | 34 | All SZGR 2.0 genes in this pathway |
| WOO LIVER CANCER RECURRENCE DN | 80 | 54 | All SZGR 2.0 genes in this pathway |
| MIKKELSEN MEF LCP WITH H3K27ME3 | 70 | 35 | All SZGR 2.0 genes in this pathway |
| MOOTHA GLYCOGEN METABOLISM | 21 | 16 | All SZGR 2.0 genes in this pathway |
| WAKABAYASHI ADIPOGENESIS PPARG BOUND 8D | 658 | 397 | All SZGR 2.0 genes in this pathway |
| GUO TARGETS OF IRS1 AND IRS2 | 98 | 67 | All SZGR 2.0 genes in this pathway |