Gene Page: SLC24A2
Summary ?
| GeneID | 25769 |
| Symbol | SLC24A2 |
| Synonyms | NCKX2 |
| Description | solute carrier family 24 member 2 |
| Reference | MIM:609838|HGNC:HGNC:10976|Ensembl:ENSG00000155886|HPRD:15351|Vega:OTTHUMG00000019646 |
| Gene type | protein-coding |
| Map location | 9p22.1 |
| Pascal p-value | 0.271 |
| Fetal beta | 0.353 |
| eGene | Meta |
| Support | CompositeSet Darnell FMRP targets |
Gene in Data Sources
| Gene set name | Method of gene set | Description | Info |
|---|---|---|---|
| CV:GWASdb | Genome-wide Association Studies | GWASdb records for schizophrenia | |
| CV:PGCnp | Genome-wide Association Study | GWAS |
Section I. Genetics and epigenetics annotation
Section II. Transcriptome annotation
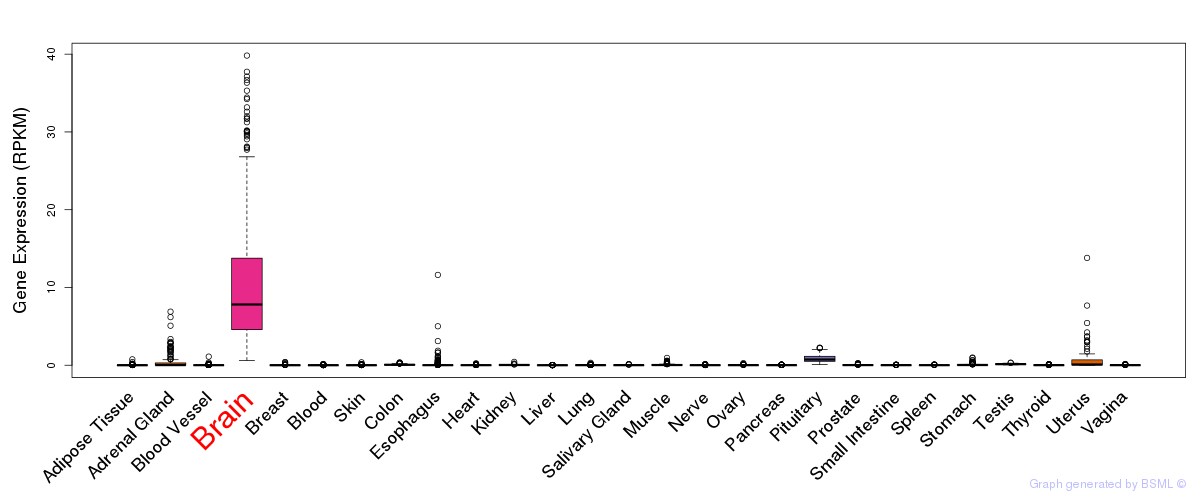
General gene expression (GTEx)
Gene expression during devlopment (BrainCloud)
Footnote:
A total of 269 time points ploted, with n=38 fetal samples (x=1:38). Each triangle represents one time point.
Gene expression of temporal and spatial changes (BrainSpan)
Footnote:
SC: sub-cortical regions; SM: sensory-motor regions; FC: frontal cortex; and TP: temporal-parietal cortex
ST1: fetal (13 - 26 postconception weeks), ST2: early infancy to late childhood (4 months to 11 years), and ST3: adolescence to adulthood (13 - 23 years)
The bar shown representes the lower 25% and upper 25% of the expression distribution.
Top co-expressed genes in brain regions
| Top 10 positively co-expressed genes | ||
| Gene | Pearson's Correlation | Spearman's Correlation |
| AXL | 0.88 | 0.93 |
| PBXIP1 | 0.88 | 0.89 |
| MLC1 | 0.87 | 0.89 |
| S1PR1 | 0.87 | 0.88 |
| HEPACAM | 0.87 | 0.87 |
| KLF15 | 0.87 | 0.91 |
| LAMB2 | 0.86 | 0.86 |
| TTYH1 | 0.86 | 0.86 |
| CTDSP1 | 0.86 | 0.88 |
| TIMP3 | 0.85 | 0.85 |
| Top 10 negatively co-expressed genes | ||
| Gene | Pearson's Correlation | Spearman's Correlation |
| MED19 | -0.55 | -0.62 |
| PPP3CC | -0.54 | -0.59 |
| STMN1 | -0.54 | -0.60 |
| GNL3 | -0.53 | -0.58 |
| FRG1 | -0.53 | -0.62 |
| NOL4 | -0.53 | -0.54 |
| KHDRBS3 | -0.53 | -0.58 |
| NELL2 | -0.53 | -0.56 |
| PAK1IP1 | -0.53 | -0.57 |
| FAM32A | -0.53 | -0.56 |
Section V. Pathway annotation
| Pathway name | Pathway size | # SZGR 2.0 genes in pathway | Info |
|---|---|---|---|
| PID CONE PATHWAY | 23 | 8 | All SZGR 2.0 genes in this pathway |
| REACTOME TRANSMEMBRANE TRANSPORT OF SMALL MOLECULES | 413 | 270 | All SZGR 2.0 genes in this pathway |
| REACTOME SLC MEDIATED TRANSMEMBRANE TRANSPORT | 241 | 157 | All SZGR 2.0 genes in this pathway |
| REACTOME TRANSPORT OF INORGANIC CATIONS ANIONS AND AMINO ACIDS OLIGOPEPTIDES | 94 | 65 | All SZGR 2.0 genes in this pathway |
| SHEN SMARCA2 TARGETS DN | 357 | 212 | All SZGR 2.0 genes in this pathway |
| URS ADIPOCYTE DIFFERENTIATION UP | 74 | 51 | All SZGR 2.0 genes in this pathway |
| YOSHIMURA MAPK8 TARGETS UP | 1305 | 895 | All SZGR 2.0 genes in this pathway |
| MEISSNER NPC HCP WITH H3K4ME3 AND H3K27ME3 | 142 | 103 | All SZGR 2.0 genes in this pathway |
| MIKKELSEN NPC HCP WITH H3K4ME3 AND H3K27ME3 | 210 | 148 | All SZGR 2.0 genes in this pathway |
| PECE MAMMARY STEM CELL DN | 146 | 88 | All SZGR 2.0 genes in this pathway |
| KUMAR PATHOGEN LOAD BY MACROPHAGES | 275 | 155 | All SZGR 2.0 genes in this pathway |