Gene Page: MYRIP
Summary ?
| GeneID | 25924 |
| Symbol | MYRIP |
| Synonyms | SLAC2-C|SLAC2C |
| Description | myosin VIIA and Rab interacting protein |
| Reference | MIM:611790|HGNC:HGNC:19156|Ensembl:ENSG00000170011|HPRD:14796|Vega:OTTHUMG00000131392 |
| Gene type | protein-coding |
| Map location | 3p22.1 |
| Pascal p-value | 0.06 |
| Sherlock p-value | 0.342 |
| Fetal beta | -2.818 |
| eGene | Cerebellar Hemisphere Cerebellum |
| Support | EXOCYTOSIS |
Gene in Data Sources
| Gene set name | Method of gene set | Description | Info |
|---|---|---|---|
| CV:GWASdb | Genome-wide Association Studies | GWASdb records for schizophrenia | |
| CV:PGCnp | Genome-wide Association Study | GWAS |
Section I. Genetics and epigenetics annotation
Section II. Transcriptome annotation
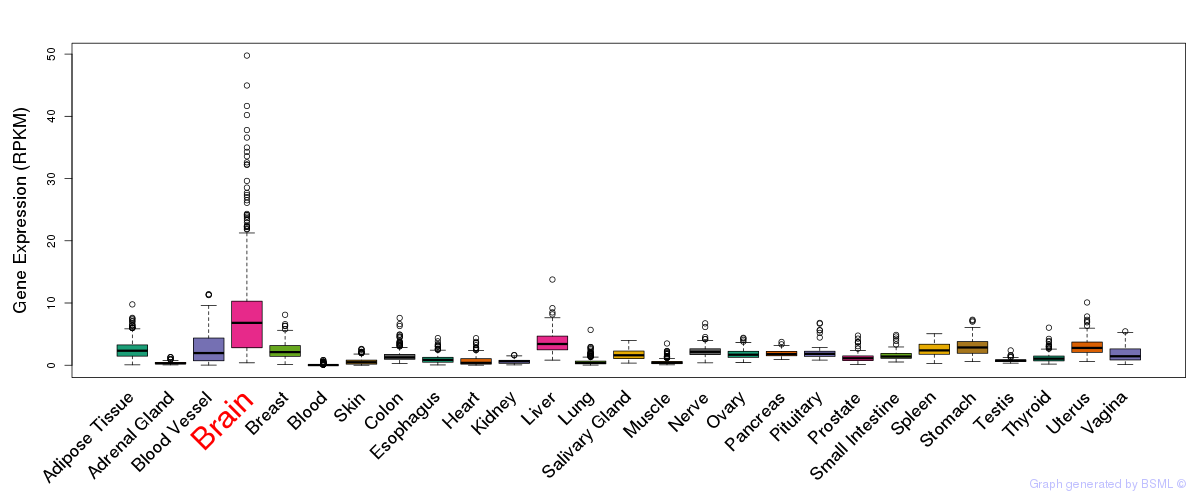
General gene expression (GTEx)
Gene expression during devlopment (BrainCloud)
Footnote:
A total of 269 time points ploted, with n=38 fetal samples (x=1:38). Each triangle represents one time point.
Gene expression of temporal and spatial changes (BrainSpan)
Footnote:
SC: sub-cortical regions; SM: sensory-motor regions; FC: frontal cortex; and TP: temporal-parietal cortex
ST1: fetal (13 - 26 postconception weeks), ST2: early infancy to late childhood (4 months to 11 years), and ST3: adolescence to adulthood (13 - 23 years)
The bar shown representes the lower 25% and upper 25% of the expression distribution.
Top co-expressed genes in brain regions
| Top 10 positively co-expressed genes | ||
| Gene | Pearson's Correlation | Spearman's Correlation |
| ILF2 | 0.91 | 0.91 |
| IFT52 | 0.90 | 0.88 |
| EIF3H | 0.89 | 0.88 |
| TSG101 | 0.89 | 0.90 |
| C14orf166 | 0.89 | 0.88 |
| BTF3 | 0.89 | 0.87 |
| PSMB7 | 0.88 | 0.89 |
| KARS | 0.88 | 0.85 |
| CCT7 | 0.88 | 0.86 |
| DIABLO | 0.88 | 0.88 |
| Top 10 negatively co-expressed genes | ||
| Gene | Pearson's Correlation | Spearman's Correlation |
| AF347015.27 | -0.71 | -0.81 |
| MT-CO2 | -0.71 | -0.80 |
| MT-CYB | -0.69 | -0.81 |
| AF347015.33 | -0.69 | -0.79 |
| AF347015.8 | -0.69 | -0.80 |
| AF347015.31 | -0.69 | -0.78 |
| AF347015.15 | -0.68 | -0.81 |
| TINAGL1 | -0.67 | -0.75 |
| AF347015.26 | -0.67 | -0.82 |
| AF347015.2 | -0.67 | -0.82 |
Section V. Pathway annotation
| Pathway name | Pathway size | # SZGR 2.0 genes in pathway | Info |
|---|---|---|---|
| VECCHI GASTRIC CANCER EARLY DN | 367 | 220 | All SZGR 2.0 genes in this pathway |
| MISSIAGLIA REGULATED BY METHYLATION UP | 126 | 78 | All SZGR 2.0 genes in this pathway |
| LASTOWSKA NEUROBLASTOMA COPY NUMBER DN | 800 | 473 | All SZGR 2.0 genes in this pathway |
| VANTVEER BREAST CANCER METASTASIS UP | 56 | 31 | All SZGR 2.0 genes in this pathway |
| ZHAN MULTIPLE MYELOMA MS UP | 48 | 32 | All SZGR 2.0 genes in this pathway |
| LIAN LIPA TARGETS 6M | 74 | 47 | All SZGR 2.0 genes in this pathway |
| ACEVEDO LIVER CANCER UP | 973 | 570 | All SZGR 2.0 genes in this pathway |
| BOQUEST STEM CELL DN | 216 | 143 | All SZGR 2.0 genes in this pathway |
| LEE LIVER CANCER SURVIVAL UP | 185 | 112 | All SZGR 2.0 genes in this pathway |
| CHIANG LIVER CANCER SUBCLASS CTNNB1 UP | 176 | 110 | All SZGR 2.0 genes in this pathway |
| CHIANG LIVER CANCER SUBCLASS PROLIFERATION DN | 179 | 97 | All SZGR 2.0 genes in this pathway |
| MEISSNER NPC HCP WITH H3K4ME2 AND H3K27ME3 | 349 | 234 | All SZGR 2.0 genes in this pathway |
| MIKKELSEN MCV6 HCP WITH H3K27ME3 | 435 | 318 | All SZGR 2.0 genes in this pathway |
| CAIRO HEPATOBLASTOMA CLASSES DN | 210 | 141 | All SZGR 2.0 genes in this pathway |
| MIKKELSEN NPC HCP WITH H3K4ME3 AND H3K27ME3 | 210 | 148 | All SZGR 2.0 genes in this pathway |
| MIKKELSEN MEF HCP WITH H3K27ME3 | 590 | 403 | All SZGR 2.0 genes in this pathway |
| KIM ALL DISORDERS OLIGODENDROCYTE NUMBER CORR UP | 756 | 494 | All SZGR 2.0 genes in this pathway |
| KIM BIPOLAR DISORDER OLIGODENDROCYTE DENSITY CORR UP | 682 | 440 | All SZGR 2.0 genes in this pathway |
| ZWANG TRANSIENTLY UP BY 2ND EGF PULSE ONLY | 1725 | 838 | All SZGR 2.0 genes in this pathway |