Gene Page: FBXO8
Summary ?
| GeneID | 26269 |
| Symbol | FBXO8 |
| Synonyms | DC10|FBS|FBX8 |
| Description | F-box protein 8 |
| Reference | MIM:605649|HGNC:HGNC:13587|Ensembl:ENSG00000164117|HPRD:07293|Vega:OTTHUMG00000160746 |
| Gene type | protein-coding |
| Map location | 4q34.1 |
| Pascal p-value | 0.033 |
| Sherlock p-value | 0.082 |
| Fetal beta | 0.442 |
| DMG | 1 (# studies) |
Gene in Data Sources
| Gene set name | Method of gene set | Description | Info |
|---|---|---|---|
| CV:PGCnp | Genome-wide Association Study | GWAS | |
| DMG:Nishioka_2013 | Genome-wide DNA methylation analysis | The authors investigated the methylation profiles of DNA in peripheral blood cells from 18 patients with first-episode schizophrenia (FESZ) and from 15 normal controls. | 1 |
Section I. Genetics and epigenetics annotation
 Differentially methylated gene
| Probe | Chromosome | Position | Nearest gene | P (dis) | Beta (dis) | FDR (dis) | Study |
|---|---|---|---|---|---|---|---|
| cg12648583 | 4 | 175205248 | FBXO8 | -0.026 | 0.43 | DMG:Nishioka_2013 |
Section II. Transcriptome annotation
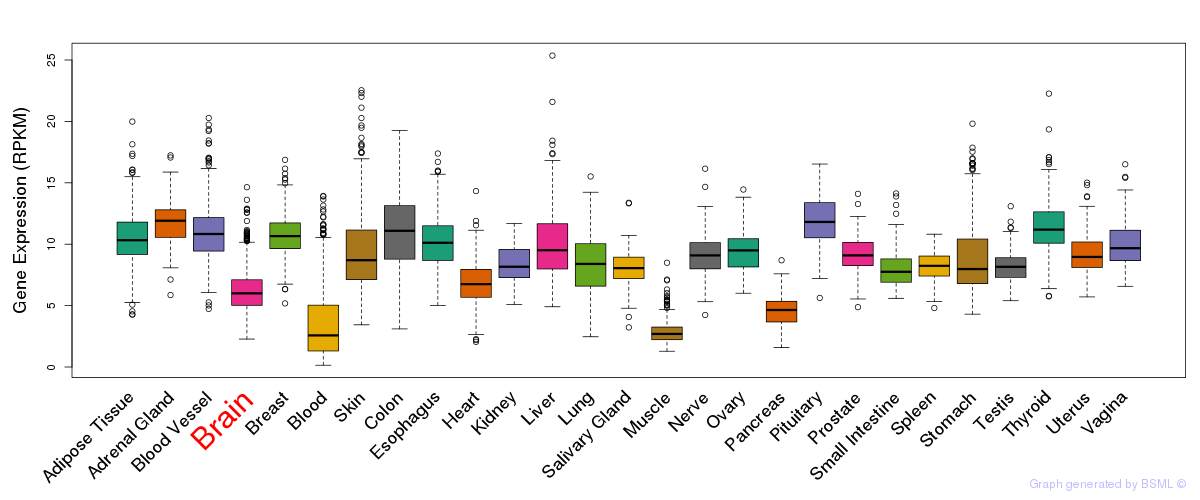
General gene expression (GTEx)
Gene expression during devlopment (BrainCloud)
Footnote:
A total of 269 time points ploted, with n=38 fetal samples (x=1:38). Each triangle represents one time point.
Gene expression of temporal and spatial changes (BrainSpan)
Footnote:
SC: sub-cortical regions; SM: sensory-motor regions; FC: frontal cortex; and TP: temporal-parietal cortex
ST1: fetal (13 - 26 postconception weeks), ST2: early infancy to late childhood (4 months to 11 years), and ST3: adolescence to adulthood (13 - 23 years)
The bar shown representes the lower 25% and upper 25% of the expression distribution.
Top co-expressed genes in brain regions
| Top 10 positively co-expressed genes | ||
| Gene | Pearson's Correlation | Spearman's Correlation |
| COX7A2 | 0.93 | 0.85 |
| UQCRQ | 0.90 | 0.80 |
| C6orf125 | 0.90 | 0.84 |
| NDUFA2 | 0.90 | 0.76 |
| AC009171.1 | 0.89 | 0.82 |
| UQCR | 0.89 | 0.72 |
| NDUFB7 | 0.89 | 0.80 |
| ATP5J2 | 0.89 | 0.79 |
| ZNHIT1 | 0.88 | 0.77 |
| NDUFA11 | 0.88 | 0.82 |
| Top 10 negatively co-expressed genes | ||
| Gene | Pearson's Correlation | Spearman's Correlation |
| MYH9 | -0.56 | -0.57 |
| TENC1 | -0.54 | -0.73 |
| KIF13A | -0.50 | -0.54 |
| TJP1 | -0.50 | -0.59 |
| WNK1 | -0.49 | -0.55 |
| KIF16B | -0.49 | -0.50 |
| FNBP1 | -0.49 | -0.51 |
| ARHGEF10 | -0.48 | -0.53 |
| DST | -0.48 | -0.51 |
| ECE1 | -0.48 | -0.48 |
Section V. Pathway annotation
| Pathway name | Pathway size | # SZGR 2.0 genes in pathway | Info |
|---|---|---|---|
| PID ARF6 PATHWAY | 35 | 27 | All SZGR 2.0 genes in this pathway |
| WANG LMO4 TARGETS UP | 372 | 227 | All SZGR 2.0 genes in this pathway |
| RICKMAN TUMOR DIFFERENTIATED WELL VS POORLY DN | 382 | 224 | All SZGR 2.0 genes in this pathway |
| UEDA PERIFERAL CLOCK | 169 | 111 | All SZGR 2.0 genes in this pathway |
| RAMALHO STEMNESS UP | 206 | 118 | All SZGR 2.0 genes in this pathway |
| JIANG HYPOXIA NORMAL | 311 | 205 | All SZGR 2.0 genes in this pathway |
| TRACEY RESISTANCE TO IFNA2 DN | 32 | 23 | All SZGR 2.0 genes in this pathway |
| CHENG IMPRINTED BY ESTRADIOL | 110 | 68 | All SZGR 2.0 genes in this pathway |
| LIN NPAS4 TARGETS UP | 163 | 100 | All SZGR 2.0 genes in this pathway |
| JOHNSTONE PARVB TARGETS 3 DN | 918 | 550 | All SZGR 2.0 genes in this pathway |
| BRUINS UVC RESPONSE LATE | 1137 | 655 | All SZGR 2.0 genes in this pathway |
| WAKABAYASHI ADIPOGENESIS PPARG RXRA BOUND 8D | 882 | 506 | All SZGR 2.0 genes in this pathway |
| WAKABAYASHI ADIPOGENESIS PPARG RXRA BOUND WITH H4K20ME1 MARK | 145 | 82 | All SZGR 2.0 genes in this pathway |