Gene Page: AMH
Summary ?
| GeneID | 268 |
| Symbol | AMH |
| Synonyms | MIF|MIS |
| Description | anti-Mullerian hormone |
| Reference | MIM:600957|HGNC:HGNC:464|Ensembl:ENSG00000104899|HPRD:02979|Vega:OTTHUMG00000180415 |
| Gene type | protein-coding |
| Map location | 19p13.3 |
| Pascal p-value | 0.001 |
| Fetal beta | 0.047 |
| eGene | Anterior cingulate cortex BA24 Caudate basal ganglia Cerebellar Hemisphere Cerebellum Cortex Frontal Cortex BA9 Hippocampus Nucleus accumbens basal ganglia Putamen basal ganglia Meta |
Gene in Data Sources
| Gene set name | Method of gene set | Description | Info |
|---|---|---|---|
| CV:PGCnp | Genome-wide Association Study | GWAS | |
| PMID:cooccur | High-throughput literature-search | Systematic search in PubMed for genes co-occurring with SCZ keywords. A total of 3027 genes were included. | |
| Literature | High-throughput literature-search | Co-occurance with Schizophrenia keywords: schizophrenia,schizophrenias | Click to show details |
Section I. Genetics and epigenetics annotation
 eQTL annotation
| SNP ID | Chromosome | Position | eGene | Gene Entrez ID | pvalue | qvalue | TSS distance | eQTL type |
|---|---|---|---|---|---|---|---|---|
| rs733846 | 19 | 2241327 | AMH | ENSG00000104899.4 | 9.71884E-7 | 0 | -7981 | gtex_brain_ba24 |
| rs2074861 | 19 | 2246652 | AMH | ENSG00000104899.4 | 8.91269E-7 | 0 | -2656 | gtex_brain_ba24 |
| rs4807216 | 19 | 2248683 | AMH | ENSG00000104899.4 | 2.67364E-9 | 0 | -625 | gtex_brain_ba24 |
| rs10407022 | 19 | 2249477 | AMH | ENSG00000104899.4 | 3.98178E-8 | 0 | 169 | gtex_brain_ba24 |
| rs733846 | 19 | 2241327 | AMH | ENSG00000104899.4 | 4.40212E-7 | 0.02 | -7981 | gtex_brain_putamen_basal |
Section II. Transcriptome annotation
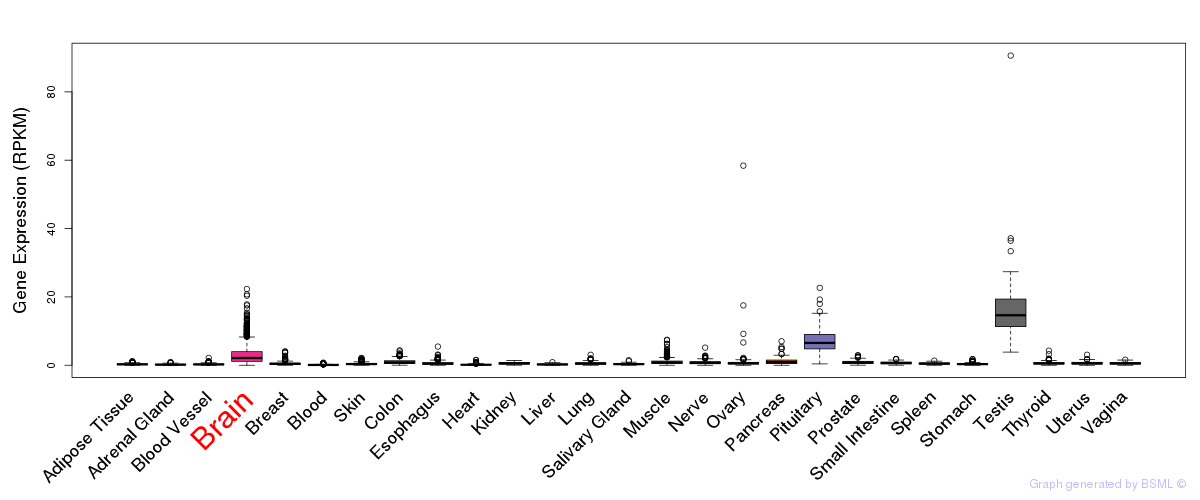
General gene expression (GTEx)
Gene expression during devlopment (BrainCloud)
Footnote:
A total of 269 time points ploted, with n=38 fetal samples (x=1:38). Each triangle represents one time point.
Gene expression of temporal and spatial changes (BrainSpan)
Footnote:
SC: sub-cortical regions; SM: sensory-motor regions; FC: frontal cortex; and TP: temporal-parietal cortex
ST1: fetal (13 - 26 postconception weeks), ST2: early infancy to late childhood (4 months to 11 years), and ST3: adolescence to adulthood (13 - 23 years)
The bar shown representes the lower 25% and upper 25% of the expression distribution.
Top co-expressed genes in brain regions
| Top 10 positively co-expressed genes | ||
| Gene | Pearson's Correlation | Spearman's Correlation |
| GIT1 | 0.88 | 0.88 |
| JPH3 | 0.87 | 0.89 |
| RANGAP1 | 0.87 | 0.85 |
| C17orf28 | 0.86 | 0.85 |
| NICN1 | 0.86 | 0.84 |
| OTUD5 | 0.86 | 0.83 |
| PTPRN2 | 0.85 | 0.88 |
| KATNB1 | 0.85 | 0.82 |
| RNF123 | 0.85 | 0.83 |
| PPP1R13B | 0.85 | 0.86 |
| Top 10 negatively co-expressed genes | ||
| Gene | Pearson's Correlation | Spearman's Correlation |
| AF347015.21 | -0.69 | -0.53 |
| AF347015.31 | -0.63 | -0.49 |
| MT-CO2 | -0.63 | -0.48 |
| AF347015.2 | -0.62 | -0.45 |
| AF347015.8 | -0.60 | -0.46 |
| AF347015.18 | -0.60 | -0.45 |
| AL139819.3 | -0.59 | -0.56 |
| NOSTRIN | -0.59 | -0.45 |
| GNG11 | -0.58 | -0.52 |
| MT-CYB | -0.58 | -0.43 |
Section V. Pathway annotation
| Pathway name | Pathway size | # SZGR 2.0 genes in pathway | Info |
|---|---|---|---|
| KEGG CYTOKINE CYTOKINE RECEPTOR INTERACTION | 267 | 161 | All SZGR 2.0 genes in this pathway |
| KEGG TGF BETA SIGNALING PATHWAY | 86 | 64 | All SZGR 2.0 genes in this pathway |
| PID ALK2 PATHWAY | 11 | 9 | All SZGR 2.0 genes in this pathway |
| KIM WT1 TARGETS 12HR DN | 209 | 122 | All SZGR 2.0 genes in this pathway |
| NADERI BREAST CANCER PROGNOSIS UP | 50 | 26 | All SZGR 2.0 genes in this pathway |
| INGRAM SHH TARGETS UP | 127 | 79 | All SZGR 2.0 genes in this pathway |
| JIANG HYPOXIA NORMAL | 311 | 205 | All SZGR 2.0 genes in this pathway |
| BANDRES RESPONSE TO CARMUSTIN WITHOUT MGMT 48HR DN | 32 | 25 | All SZGR 2.0 genes in this pathway |
| BANDRES RESPONSE TO CARMUSTIN MGMT 48HR DN | 161 | 105 | All SZGR 2.0 genes in this pathway |
| BONOME OVARIAN CANCER SURVIVAL SUBOPTIMAL DEBULKING | 510 | 309 | All SZGR 2.0 genes in this pathway |
| MIKKELSEN ES ICP WITH H3K4ME3 | 718 | 401 | All SZGR 2.0 genes in this pathway |
| NABA SECRETED FACTORS | 344 | 197 | All SZGR 2.0 genes in this pathway |
| NABA MATRISOME ASSOCIATED | 753 | 411 | All SZGR 2.0 genes in this pathway |
| NABA MATRISOME | 1028 | 559 | All SZGR 2.0 genes in this pathway |