Gene Page: TRAPPC3
Summary ?
| GeneID | 27095 |
| Symbol | TRAPPC3 |
| Synonyms | BET3 |
| Description | trafficking protein particle complex 3 |
| Reference | MIM:610955|HGNC:HGNC:19942|Ensembl:ENSG00000054116|HPRD:11644|Vega:OTTHUMG00000007664 |
| Gene type | protein-coding |
| Map location | 1p34.3 |
| Pascal p-value | 2.719E-5 |
| Sherlock p-value | 0.003 |
| Fetal beta | -0.337 |
| Support | G2Cdb.human_BAYES-COLLINS-HUMAN-PSD-CONSENSUS CompositeSet |
Gene in Data Sources
| Gene set name | Method of gene set | Description | Info |
|---|---|---|---|
| CV:PGCnp | Genome-wide Association Study | GWAS |
Section I. Genetics and epigenetics annotation
Section II. Transcriptome annotation
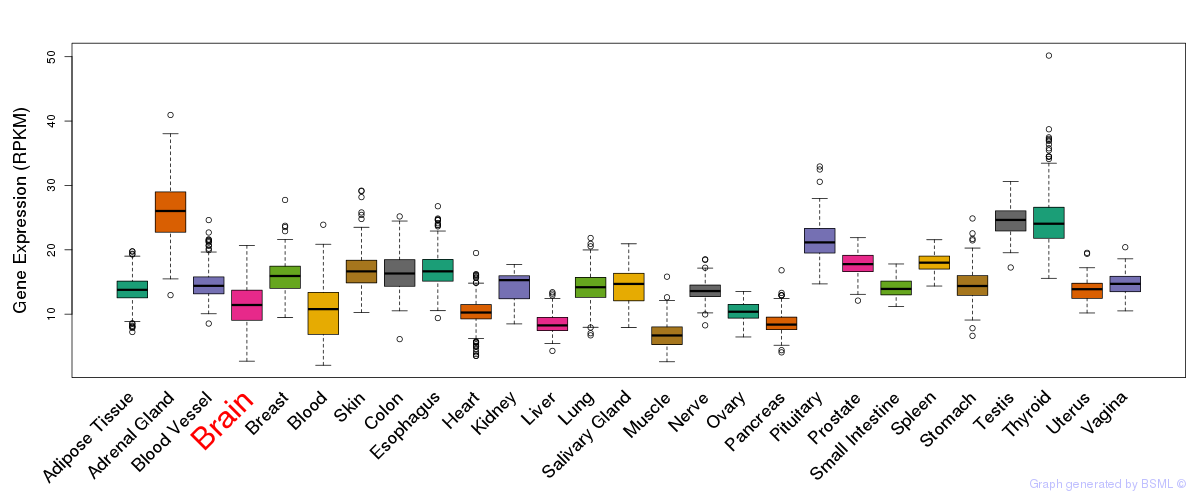
General gene expression (GTEx)
Gene expression during devlopment (BrainCloud)
Footnote:
A total of 269 time points ploted, with n=38 fetal samples (x=1:38). Each triangle represents one time point.
Gene expression of temporal and spatial changes (BrainSpan)
Footnote:
SC: sub-cortical regions; SM: sensory-motor regions; FC: frontal cortex; and TP: temporal-parietal cortex
ST1: fetal (13 - 26 postconception weeks), ST2: early infancy to late childhood (4 months to 11 years), and ST3: adolescence to adulthood (13 - 23 years)
The bar shown representes the lower 25% and upper 25% of the expression distribution.
Top co-expressed genes in brain regions
| Top 10 positively co-expressed genes | ||
| Gene | Pearson's Correlation | Spearman's Correlation |
| PARP4 | 0.66 | 0.56 |
| MSN | 0.65 | 0.48 |
| FAM114A1 | 0.62 | 0.52 |
| M6PRBP1 | 0.62 | 0.57 |
| SALL1 | 0.61 | 0.49 |
| SEPT10 | 0.61 | 0.46 |
| YAP1 | 0.61 | 0.55 |
| BTN2A2 | 0.59 | 0.51 |
| SULT1C4 | 0.59 | 0.56 |
| SLC2A10 | 0.59 | 0.43 |
| Top 10 negatively co-expressed genes | ||
| Gene | Pearson's Correlation | Spearman's Correlation |
| IER5L | -0.29 | -0.27 |
| GPR22 | -0.26 | -0.26 |
| SLC26A4 | -0.26 | -0.26 |
| C3orf54 | -0.24 | -0.24 |
| LMO7 | -0.24 | -0.16 |
| LRFN2 | -0.24 | -0.21 |
| TTC9B | -0.24 | -0.30 |
| KLHL1 | -0.24 | -0.17 |
| RPRM | -0.23 | -0.23 |
| MPPED1 | -0.23 | -0.21 |
Section V. Pathway annotation
| Pathway name | Pathway size | # SZGR 2.0 genes in pathway | Info |
|---|---|---|---|
| DIAZ CHRONIC MEYLOGENOUS LEUKEMIA UP | 1382 | 904 | All SZGR 2.0 genes in this pathway |
| MULLIGHAN NPM1 MUTATED SIGNATURE 1 UP | 276 | 165 | All SZGR 2.0 genes in this pathway |
| MULLIGHAN NPM1 SIGNATURE 3 UP | 341 | 197 | All SZGR 2.0 genes in this pathway |
| LASTOWSKA NEUROBLASTOMA COPY NUMBER DN | 800 | 473 | All SZGR 2.0 genes in this pathway |
| SPIELMAN LYMPHOBLAST EUROPEAN VS ASIAN DN | 584 | 395 | All SZGR 2.0 genes in this pathway |
| RICKMAN TUMOR DIFFERENTIATED WELL VS POORLY DN | 382 | 224 | All SZGR 2.0 genes in this pathway |
| BENPORATH MYC MAX TARGETS | 775 | 494 | All SZGR 2.0 genes in this pathway |
| IVANOVA HEMATOPOIESIS STEM CELL SHORT TERM | 32 | 15 | All SZGR 2.0 genes in this pathway |
| PELLICCIOTTA HDAC IN ANTIGEN PRESENTATION UP | 64 | 40 | All SZGR 2.0 genes in this pathway |
| YAGI AML WITH INV 16 TRANSLOCATION | 422 | 277 | All SZGR 2.0 genes in this pathway |
| DANG BOUND BY MYC | 1103 | 714 | All SZGR 2.0 genes in this pathway |
| BRUINS UVC RESPONSE VIA TP53 GROUP A | 898 | 516 | All SZGR 2.0 genes in this pathway |
| KOINUMA TARGETS OF SMAD2 OR SMAD3 | 824 | 528 | All SZGR 2.0 genes in this pathway |