Gene Page: GSTZ1
Summary ?
| GeneID | 2954 |
| Symbol | GSTZ1 |
| Synonyms | GSTZ1-1|MAAI|MAI |
| Description | glutathione S-transferase zeta 1 |
| Reference | MIM:603758|HGNC:HGNC:4643|Ensembl:ENSG00000100577|HPRD:04785|Vega:OTTHUMG00000171551 |
| Gene type | protein-coding |
| Map location | 14q24.3 |
| Pascal p-value | 0.259 |
| Fetal beta | -0.995 |
| DMG | 2 (# studies) |
| eGene | Cerebellar Hemisphere Cortex Frontal Cortex BA9 |
Gene in Data Sources
| Gene set name | Method of gene set | Description | Info |
|---|---|---|---|
| CV:PGCnp | Genome-wide Association Study | GWAS | |
| DMG:Jaffe_2016 | Genome-wide DNA methylation analysis | This dataset includes 2,104 probes/CpGs associated with SZ patients (n=108) compared to 136 controls at Bonferroni-adjusted P < 0.05. | 2 |
| DMG:Nishioka_2013 | Genome-wide DNA methylation analysis | The authors investigated the methylation profiles of DNA in peripheral blood cells from 18 patients with first-episode schizophrenia (FESZ) and from 15 normal controls. | 2 |
| PMID:cooccur | High-throughput literature-search | Systematic search in PubMed for genes co-occurring with SCZ keywords. A total of 3027 genes were included. | |
| Literature | High-throughput literature-search | Co-occurance with Schizophrenia keywords: schizophrenia,schizophrenias | Click to show details |
Section I. Genetics and epigenetics annotation
 Differentially methylated gene
| Probe | Chromosome | Position | Nearest gene | P (dis) | Beta (dis) | FDR (dis) | Study |
|---|---|---|---|---|---|---|---|
| cg14685339 | 14 | 77787351 | GSTZ1 | -0.024 | 0.25 | DMG:Nishioka_2013 | |
| cg14685339 | 14 | 77787351 | GSTZ1 | 6.93E-9 | -0.015 | 3.53E-6 | DMG:Jaffe_2016 |
Section II. Transcriptome annotation
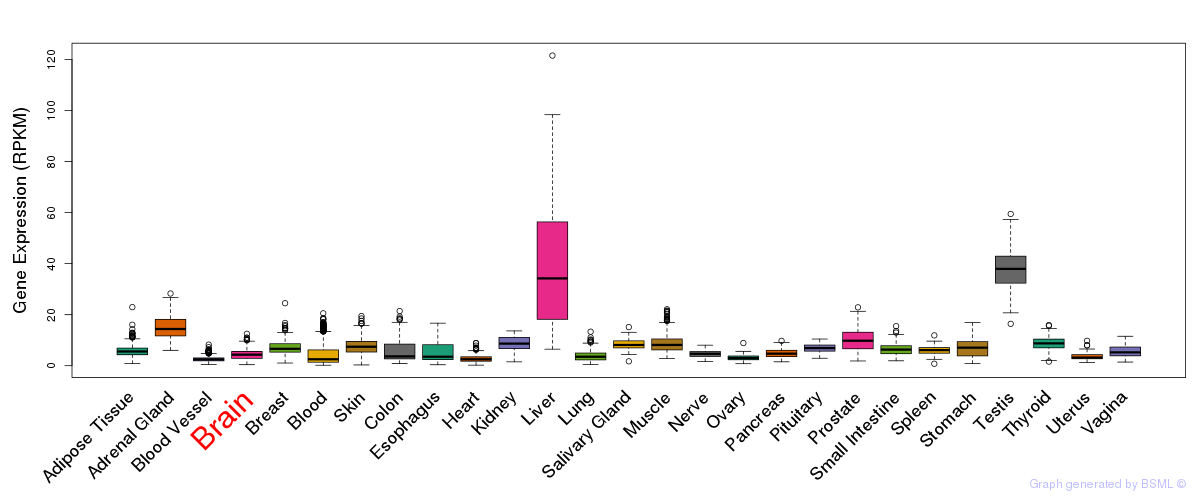
General gene expression (GTEx)
Gene expression during devlopment (BrainCloud)
Footnote:
A total of 269 time points ploted, with n=38 fetal samples (x=1:38). Each triangle represents one time point.
Gene expression of temporal and spatial changes (BrainSpan)
Footnote:
SC: sub-cortical regions; SM: sensory-motor regions; FC: frontal cortex; and TP: temporal-parietal cortex
ST1: fetal (13 - 26 postconception weeks), ST2: early infancy to late childhood (4 months to 11 years), and ST3: adolescence to adulthood (13 - 23 years)
The bar shown representes the lower 25% and upper 25% of the expression distribution.
Top co-expressed genes in brain regions
| Top 10 positively co-expressed genes | ||
| Gene | Pearson's Correlation | Spearman's Correlation |
| C11orf73 | 0.90 | 0.90 |
| ZNF32 | 0.89 | 0.88 |
| ATP5C1 | 0.88 | 0.87 |
| ZNHIT3 | 0.88 | 0.84 |
| ATP5O | 0.87 | 0.86 |
| ATP5L | 0.86 | 0.86 |
| PSMB3 | 0.85 | 0.84 |
| PSMA6 | 0.85 | 0.86 |
| RBX1 | 0.84 | 0.86 |
| NFU1 | 0.84 | 0.83 |
| Top 10 negatively co-expressed genes | ||
| Gene | Pearson's Correlation | Spearman's Correlation |
| MYH9 | -0.57 | -0.56 |
| PPP1R13L | -0.56 | -0.59 |
| TRIM56 | -0.55 | -0.62 |
| RRBP1 | -0.55 | -0.62 |
| PTRF | -0.54 | -0.57 |
| FAM38A | -0.54 | -0.61 |
| MYH14 | -0.53 | -0.57 |
| CASKIN2 | -0.53 | -0.57 |
| FYCO1 | -0.52 | -0.61 |
| Z83840.4 | -0.51 | -0.57 |
Section V. Pathway annotation
| Pathway name | Pathway size | # SZGR 2.0 genes in pathway | Info |
|---|---|---|---|
| KEGG TYROSINE METABOLISM | 42 | 30 | All SZGR 2.0 genes in this pathway |
| KEGG GLUTATHIONE METABOLISM | 50 | 34 | All SZGR 2.0 genes in this pathway |
| KEGG METABOLISM OF XENOBIOTICS BY CYTOCHROME P450 | 70 | 44 | All SZGR 2.0 genes in this pathway |
| KEGG DRUG METABOLISM CYTOCHROME P450 | 72 | 47 | All SZGR 2.0 genes in this pathway |
| REACTOME METABOLISM OF AMINO ACIDS AND DERIVATIVES | 200 | 136 | All SZGR 2.0 genes in this pathway |
| DODD NASOPHARYNGEAL CARCINOMA UP | 1821 | 933 | All SZGR 2.0 genes in this pathway |
| LANDIS ERBB2 BREAST PRENEOPLASTIC DN | 55 | 33 | All SZGR 2.0 genes in this pathway |
| GRAESSMANN APOPTOSIS BY DOXORUBICIN UP | 1142 | 669 | All SZGR 2.0 genes in this pathway |
| GRAESSMANN RESPONSE TO MC AND DOXORUBICIN UP | 612 | 367 | All SZGR 2.0 genes in this pathway |
| LANDIS ERBB2 BREAST TUMORS 324 DN | 149 | 93 | All SZGR 2.0 genes in this pathway |
| BERENJENO TRANSFORMED BY RHOA DN | 394 | 258 | All SZGR 2.0 genes in this pathway |
| DARWICHE SKIN TUMOR PROMOTER DN | 185 | 115 | All SZGR 2.0 genes in this pathway |
| DARWICHE PAPILLOMA RISK LOW DN | 165 | 107 | All SZGR 2.0 genes in this pathway |
| DARWICHE PAPILLOMA RISK HIGH DN | 180 | 110 | All SZGR 2.0 genes in this pathway |
| DARWICHE SQUAMOUS CELL CARCINOMA DN | 181 | 107 | All SZGR 2.0 genes in this pathway |
| FARMER BREAST CANCER APOCRINE VS BASAL | 330 | 217 | All SZGR 2.0 genes in this pathway |
| FARMER BREAST CANCER BASAL VS LULMINAL | 330 | 215 | All SZGR 2.0 genes in this pathway |
| GRUETZMANN PANCREATIC CANCER DN | 203 | 134 | All SZGR 2.0 genes in this pathway |
| YANG BREAST CANCER ESR1 LASER UP | 34 | 25 | All SZGR 2.0 genes in this pathway |
| INGRAM SHH TARGETS UP | 127 | 79 | All SZGR 2.0 genes in this pathway |
| SASAKI ADULT T CELL LEUKEMIA | 176 | 122 | All SZGR 2.0 genes in this pathway |
| HSIAO LIVER SPECIFIC GENES | 244 | 154 | All SZGR 2.0 genes in this pathway |
| PAL PRMT5 TARGETS UP | 203 | 135 | All SZGR 2.0 genes in this pathway |
| WELCSH BRCA1 TARGETS UP | 198 | 132 | All SZGR 2.0 genes in this pathway |
| BURTON ADIPOGENESIS 6 | 189 | 112 | All SZGR 2.0 genes in this pathway |
| CREIGHTON ENDOCRINE THERAPY RESISTANCE 1 | 528 | 324 | All SZGR 2.0 genes in this pathway |
| WONG MITOCHONDRIA GENE MODULE | 217 | 122 | All SZGR 2.0 genes in this pathway |
| MARTINEZ RB1 TARGETS UP | 673 | 430 | All SZGR 2.0 genes in this pathway |
| MARTINEZ TP53 TARGETS UP | 602 | 364 | All SZGR 2.0 genes in this pathway |
| MARTINEZ RB1 AND TP53 TARGETS UP | 601 | 369 | All SZGR 2.0 genes in this pathway |
| SMID BREAST CANCER LUMINAL B UP | 172 | 109 | All SZGR 2.0 genes in this pathway |
| SMID BREAST CANCER BASAL DN | 701 | 446 | All SZGR 2.0 genes in this pathway |
| HOSHIDA LIVER CANCER SUBCLASS S3 | 266 | 180 | All SZGR 2.0 genes in this pathway |
| CAIRO HEPATOBLASTOMA DN | 267 | 160 | All SZGR 2.0 genes in this pathway |
| BRUINS UVC RESPONSE LATE | 1137 | 655 | All SZGR 2.0 genes in this pathway |