Gene Page: SERTAD1
Summary ?
| GeneID | 29950 |
| Symbol | SERTAD1 |
| Synonyms | SEI1|TRIP-Br1 |
| Description | SERTA domain containing 1 |
| Reference | HGNC:HGNC:17932|HPRD:15326| |
| Gene type | protein-coding |
| Map location | 19q13.1-q13.2 |
| Pascal p-value | 0.564 |
| Sherlock p-value | 0.109 |
| Fetal beta | -0.197 |
| DMG | 1 (# studies) |
| eGene | Myers' cis & trans Meta |
Gene in Data Sources
| Gene set name | Method of gene set | Description | Info |
|---|---|---|---|
| DMG:Nishioka_2013 | Genome-wide DNA methylation analysis | The authors investigated the methylation profiles of DNA in peripheral blood cells from 18 patients with first-episode schizophrenia (FESZ) and from 15 normal controls. | 1 |
Section I. Genetics and epigenetics annotation
 Differentially methylated gene
| Probe | Chromosome | Position | Nearest gene | P (dis) | Beta (dis) | FDR (dis) | Study |
|---|---|---|---|---|---|---|---|
| cg25060020 | 19 | 40932140 | SERTAD1 | -0.021 | 0.96 | DMG:Nishioka_2013 |
eQTL annotation
| SNP ID | Chromosome | Position | eGene | Gene Entrez ID | pvalue | qvalue | TSS distance | eQTL type |
|---|---|---|---|---|---|---|---|---|
| rs12030788 | chr1 | 66768128 | SERTAD1 | 29950 | 0.09 | trans | ||
| rs6666937 | chr1 | 170286842 | SERTAD1 | 29950 | 0.09 | trans | ||
| rs11127467 | chr2 | 12993 | SERTAD1 | 29950 | 0 | trans | ||
| rs16827037 | chr3 | 117203284 | SERTAD1 | 29950 | 3.733E-4 | trans | ||
| rs614566 | chr3 | 182847389 | SERTAD1 | 29950 | 0.17 | trans | ||
| rs7631640 | chr3 | 182883407 | SERTAD1 | 29950 | 0.16 | trans | ||
| rs1009606 | chr6 | 5726368 | SERTAD1 | 29950 | 0.08 | trans | ||
| rs3888778 | chr6 | 30529621 | SERTAD1 | 29950 | 0.06 | trans | ||
| rs2239516 | chr6 | 30578047 | SERTAD1 | 29950 | 0.16 | trans | ||
| rs6904236 | chr6 | 30596134 | SERTAD1 | 29950 | 0.1 | trans | ||
| rs887719 | chr7 | 21184272 | SERTAD1 | 29950 | 0.08 | trans | ||
| rs320082 | chr7 | 29105404 | SERTAD1 | 29950 | 1.407E-4 | trans | ||
| rs317720 | chr7 | 29110633 | SERTAD1 | 29950 | 0.01 | trans | ||
| rs317714 | chr7 | 29115553 | SERTAD1 | 29950 | 3.901E-5 | trans | ||
| rs317724 | chr7 | 29120565 | SERTAD1 | 29950 | 0.01 | trans | ||
| rs1419793 | chr7 | 34697630 | SERTAD1 | 29950 | 9.321E-5 | trans | ||
| rs16886605 | chr8 | 115894398 | SERTAD1 | 29950 | 0.09 | trans | ||
| rs10282827 | chr8 | 138034102 | SERTAD1 | 29950 | 0.02 | trans | ||
| rs10834670 | chr11 | 25404015 | SERTAD1 | 29950 | 1.418E-5 | trans | ||
| rs10834671 | chr11 | 25404269 | SERTAD1 | 29950 | 2.518E-5 | trans | ||
| rs11019015 | chr11 | 90157517 | SERTAD1 | 29950 | 0.01 | trans | ||
| rs11066476 | chr12 | 113465366 | SERTAD1 | 29950 | 0.17 | trans | ||
| rs4497566 | chr13 | 51694324 | SERTAD1 | 29950 | 6.706E-5 | trans | ||
| rs11846180 | chr14 | 51377031 | SERTAD1 | 29950 | 0.11 | trans | ||
| rs1307687 | 0 | SERTAD1 | 29950 | 0.07 | trans | |||
| rs11158850 | chr14 | 70757171 | SERTAD1 | 29950 | 0.02 | trans | ||
| rs1846326 | chr15 | 28063877 | SERTAD1 | 29950 | 0.16 | trans | ||
| rs12452652 | chr17 | 72235560 | SERTAD1 | 29950 | 0.02 | trans | ||
| rs9646596 | chr18 | 53049211 | SERTAD1 | 29950 | 0.02 | trans | ||
| rs11152369 | chr18 | 53066327 | SERTAD1 | 29950 | 0.11 | trans | ||
| rs1230712 | chr18 | 54992531 | SERTAD1 | 29950 | 0.05 | trans |
Section II. Transcriptome annotation
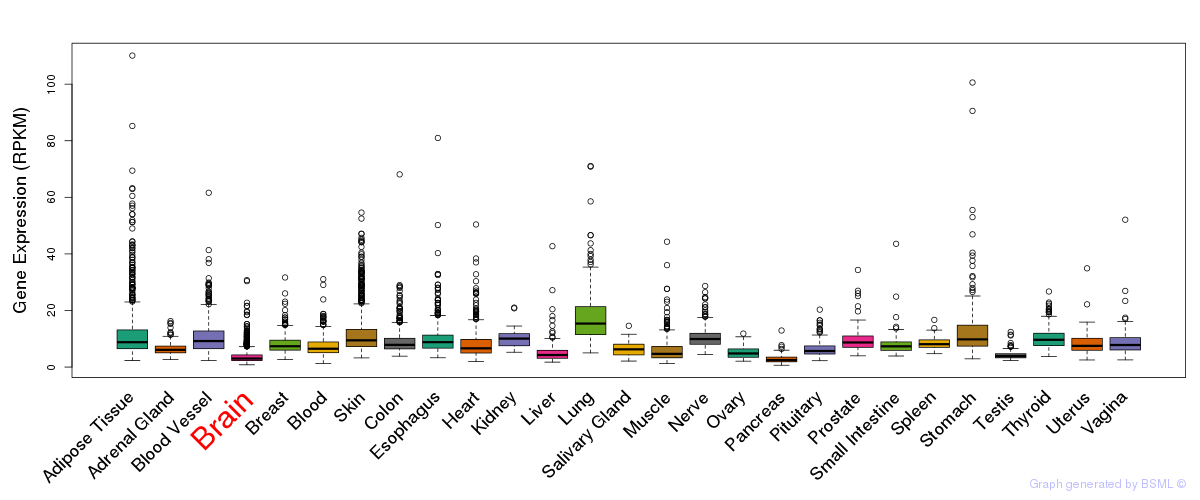
General gene expression (GTEx)
Gene expression during devlopment (BrainCloud)
Footnote:
A total of 269 time points ploted, with n=38 fetal samples (x=1:38). Each triangle represents one time point.
Gene expression of temporal and spatial changes (BrainSpan)
Footnote:
SC: sub-cortical regions; SM: sensory-motor regions; FC: frontal cortex; and TP: temporal-parietal cortex
ST1: fetal (13 - 26 postconception weeks), ST2: early infancy to late childhood (4 months to 11 years), and ST3: adolescence to adulthood (13 - 23 years)
The bar shown representes the lower 25% and upper 25% of the expression distribution.
No co-expressed genes in brain regions
Section V. Pathway annotation
| Pathway name | Pathway size | # SZGR 2.0 genes in pathway | Info |
|---|---|---|---|
| WANG LMO4 TARGETS UP | 372 | 227 | All SZGR 2.0 genes in this pathway |
| GARGALOVIC RESPONSE TO OXIDIZED PHOSPHOLIPIDS BLUE UP | 136 | 80 | All SZGR 2.0 genes in this pathway |
| JAZAG TGFB1 SIGNALING VIA SMAD4 UP | 108 | 66 | All SZGR 2.0 genes in this pathway |
| NUYTTEN EZH2 TARGETS UP | 1037 | 673 | All SZGR 2.0 genes in this pathway |
| INGRAM SHH TARGETS DN | 64 | 41 | All SZGR 2.0 genes in this pathway |
| BENPORATH MYC MAX TARGETS | 775 | 494 | All SZGR 2.0 genes in this pathway |
| YAO HOXA10 TARGETS VIA PROGESTERONE UP | 79 | 58 | All SZGR 2.0 genes in this pathway |
| MARTINEZ RESPONSE TO TRABECTEDIN UP | 71 | 49 | All SZGR 2.0 genes in this pathway |
| BURTON ADIPOGENESIS 8 | 86 | 57 | All SZGR 2.0 genes in this pathway |
| BRACHAT RESPONSE TO CAMPTOTHECIN UP | 28 | 18 | All SZGR 2.0 genes in this pathway |
| MONNIER POSTRADIATION TUMOR ESCAPE DN | 373 | 196 | All SZGR 2.0 genes in this pathway |
| MARSON BOUND BY FOXP3 UNSTIMULATED | 1229 | 713 | All SZGR 2.0 genes in this pathway |
| FOSTER TOLERANT MACROPHAGE DN | 409 | 268 | All SZGR 2.0 genes in this pathway |
| ACEVEDO NORMAL TISSUE ADJACENT TO LIVER TUMOR DN | 354 | 216 | All SZGR 2.0 genes in this pathway |
| ACEVEDO LIVER CANCER DN | 540 | 340 | All SZGR 2.0 genes in this pathway |
| ACEVEDO LIVER TUMOR VS NORMAL ADJACENT TISSUE DN | 274 | 165 | All SZGR 2.0 genes in this pathway |
| LIN NPAS4 TARGETS DN | 68 | 48 | All SZGR 2.0 genes in this pathway |
| BYSTRYKH HEMATOPOIESIS STEM CELL IL3RA | 9 | 6 | All SZGR 2.0 genes in this pathway |
| DANG BOUND BY MYC | 1103 | 714 | All SZGR 2.0 genes in this pathway |
| WONG ADULT TISSUE STEM MODULE | 721 | 492 | All SZGR 2.0 genes in this pathway |
| YAO TEMPORAL RESPONSE TO PROGESTERONE CLUSTER 7 | 76 | 46 | All SZGR 2.0 genes in this pathway |
| LI INDUCED T TO NATURAL KILLER UP | 307 | 182 | All SZGR 2.0 genes in this pathway |
| QI HYPOXIA | 140 | 96 | All SZGR 2.0 genes in this pathway |
| LIU IL13 PRIMING MODEL | 15 | 11 | All SZGR 2.0 genes in this pathway |
| ZWANG CLASS 1 TRANSIENTLY INDUCED BY EGF | 516 | 308 | All SZGR 2.0 genes in this pathway |