Gene Page: AQP2
Summary ?
| GeneID | 359 |
| Symbol | AQP2 |
| Synonyms | AQP-CD|WCH-CD |
| Description | aquaporin 2 |
| Reference | MIM:107777|HGNC:HGNC:634|Ensembl:ENSG00000167580|HPRD:00141|Vega:OTTHUMG00000169709 |
| Gene type | protein-coding |
| Map location | 12q13.12 |
| Pascal p-value | 0.162 |
| DMG | 1 (# studies) |
Gene in Data Sources
| Gene set name | Method of gene set | Description | Info |
|---|---|---|---|
| CV:PGCnp | Genome-wide Association Study | GWAS | |
| DMG:Wockner_2014 | Genome-wide DNA methylation analysis | This dataset includes 4641 differentially methylated probes corresponding to 2929 unique genes between schizophrenia patients (n=24) and controls (n=24). | 2 |
Section I. Genetics and epigenetics annotation
 Differentially methylated gene
| Probe | Chromosome | Position | Nearest gene | P (dis) | Beta (dis) | FDR (dis) | Study |
|---|---|---|---|---|---|---|---|
| cg05361096 | 12 | 50349307 | AQP2 | 2.62E-5 | 0.369 | 0.017 | DMG:Wockner_2014 |
| cg06734406 | 12 | 50349329 | AQP2 | 5.2E-5 | 0.386 | 0.022 | DMG:Wockner_2014 |
Section II. Transcriptome annotation
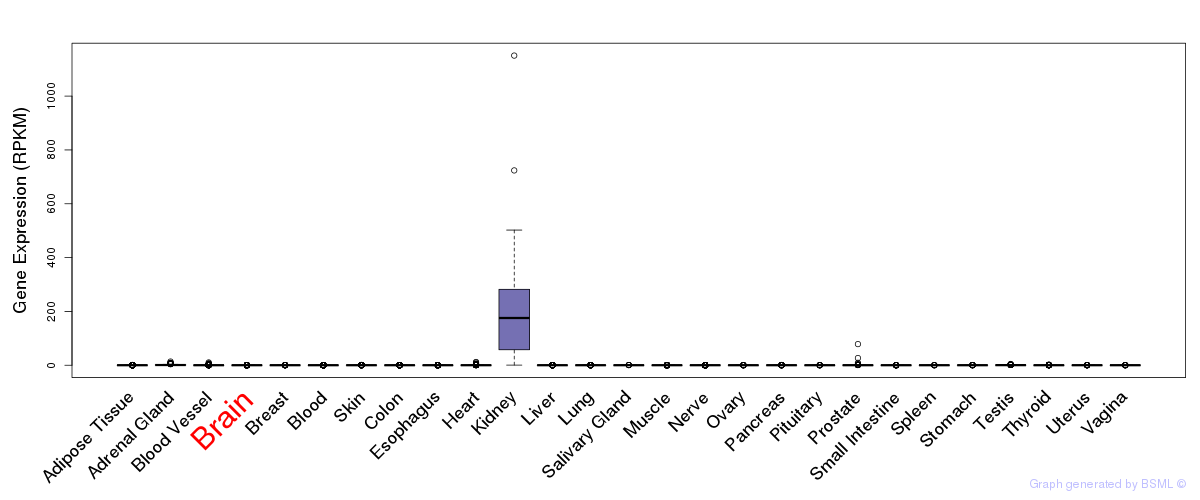
General gene expression (GTEx)
Gene expression of temporal and spatial changes (BrainSpan)
Footnote:
SC: sub-cortical regions; SM: sensory-motor regions; FC: frontal cortex; and TP: temporal-parietal cortex
ST1: fetal (13 - 26 postconception weeks), ST2: early infancy to late childhood (4 months to 11 years), and ST3: adolescence to adulthood (13 - 23 years)
The bar shown representes the lower 25% and upper 25% of the expression distribution.
Top co-expressed genes in brain regions
| Top 10 positively co-expressed genes | ||
| Gene | Pearson's Correlation | Spearman's Correlation |
| NTSR2 | 0.62 | 0.53 |
| EFEMP2 | 0.62 | 0.65 |
| ACADS | 0.61 | 0.65 |
| PLCD1 | 0.61 | 0.63 |
| TST | 0.61 | 0.63 |
| NKAIN4 | 0.60 | 0.64 |
| IL17RC | 0.60 | 0.60 |
| GATSL3 | 0.59 | 0.63 |
| APOE | 0.59 | 0.56 |
| ACOX2 | 0.58 | 0.58 |
| Top 10 negatively co-expressed genes | ||
| Gene | Pearson's Correlation | Spearman's Correlation |
| ERC2 | -0.51 | -0.60 |
| PPFIA2 | -0.51 | -0.56 |
| PDS5B | -0.51 | -0.57 |
| MDGA2 | -0.49 | -0.58 |
| ADRBK2 | -0.49 | -0.55 |
| TRAPPC6B | -0.49 | -0.57 |
| KIF3B | -0.49 | -0.55 |
| RABEP1 | -0.49 | -0.56 |
| MAP2 | -0.48 | -0.54 |
| AGTPBP1 | -0.48 | -0.55 |
Section V. Pathway annotation
| Pathway name | Pathway size | # SZGR 2.0 genes in pathway | Info |
|---|---|---|---|
| KEGG VASOPRESSIN REGULATED WATER REABSORPTION | 44 | 30 | All SZGR 2.0 genes in this pathway |
| REACTOME TRANSMEMBRANE TRANSPORT OF SMALL MOLECULES | 413 | 270 | All SZGR 2.0 genes in this pathway |
| REACTOME PASSIVE TRANSPORT BY AQUAPORINS | 11 | 7 | All SZGR 2.0 genes in this pathway |
| REACTOME AQUAPORIN MEDIATED TRANSPORT | 51 | 34 | All SZGR 2.0 genes in this pathway |
| REACTOME REGULATION OF WATER BALANCE BY RENAL AQUAPORINS | 44 | 30 | All SZGR 2.0 genes in this pathway |
| ODONNELL TFRC TARGETS UP | 456 | 228 | All SZGR 2.0 genes in this pathway |
| BENPORATH NANOG TARGETS | 988 | 594 | All SZGR 2.0 genes in this pathway |
| BENPORATH SOX2 TARGETS | 734 | 436 | All SZGR 2.0 genes in this pathway |
| TARTE PLASMA CELL VS PLASMABLAST UP | 398 | 262 | All SZGR 2.0 genes in this pathway |
| SU KIDNEY | 15 | 8 | All SZGR 2.0 genes in this pathway |
| YOSHIMURA MAPK8 TARGETS UP | 1305 | 895 | All SZGR 2.0 genes in this pathway |
| ZHAN VARIABLE EARLY DIFFERENTIATION GENES UP | 15 | 9 | All SZGR 2.0 genes in this pathway |
| MIKKELSEN MEF ICP WITH H3K27ME3 | 206 | 108 | All SZGR 2.0 genes in this pathway |
| SETLUR PROSTATE CANCER TMPRSS2 ERG FUSION DN | 20 | 12 | All SZGR 2.0 genes in this pathway |
| MIKKELSEN ES ICP WITH H3K4ME3 AND H3K27ME3 | 137 | 85 | All SZGR 2.0 genes in this pathway |
| STAMBOLSKY TARGETS OF MUTATED TP53 UP | 49 | 35 | All SZGR 2.0 genes in this pathway |
| PURBEY TARGETS OF CTBP1 NOT SATB1 UP | 344 | 215 | All SZGR 2.0 genes in this pathway |