Gene Page: LEP
Summary ?
| GeneID | 3952 |
| Symbol | LEP |
| Synonyms | LEPD|OB|OBS |
| Description | leptin |
| Reference | MIM:164160|HGNC:HGNC:6553|Ensembl:ENSG00000174697|HPRD:01249|Vega:OTTHUMG00000157564 |
| Gene type | protein-coding |
| Map location | 7q31.3 |
| Pascal p-value | 0.382 |
| Fetal beta | 0.075 |
| DMG | 1 (# studies) |
Gene in Data Sources
| Gene set name | Method of gene set | Description | Info |
|---|---|---|---|
| CV:PGCnp | Genome-wide Association Study | GWAS | |
| DMG:Jaffe_2016 | Genome-wide DNA methylation analysis | This dataset includes 2,104 probes/CpGs associated with SZ patients (n=108) compared to 136 controls at Bonferroni-adjusted P < 0.05. | 1 |
| PMID:cooccur | High-throughput literature-search | Systematic search in PubMed for genes co-occurring with SCZ keywords. A total of 3027 genes were included. | |
| Literature | High-throughput literature-search | Co-occurance with Schizophrenia keywords: schizophrenia,schizophrenic,schizophrenias | Click to show details |
Section I. Genetics and epigenetics annotation
 Differentially methylated gene
| Probe | Chromosome | Position | Nearest gene | P (dis) | Beta (dis) | FDR (dis) | Study |
|---|---|---|---|---|---|---|---|
| cg01337813 | 7 | 127808512 | LEP | 1.14E-9 | -0.025 | 1.25E-6 | DMG:Jaffe_2016 |
Section II. Transcriptome annotation
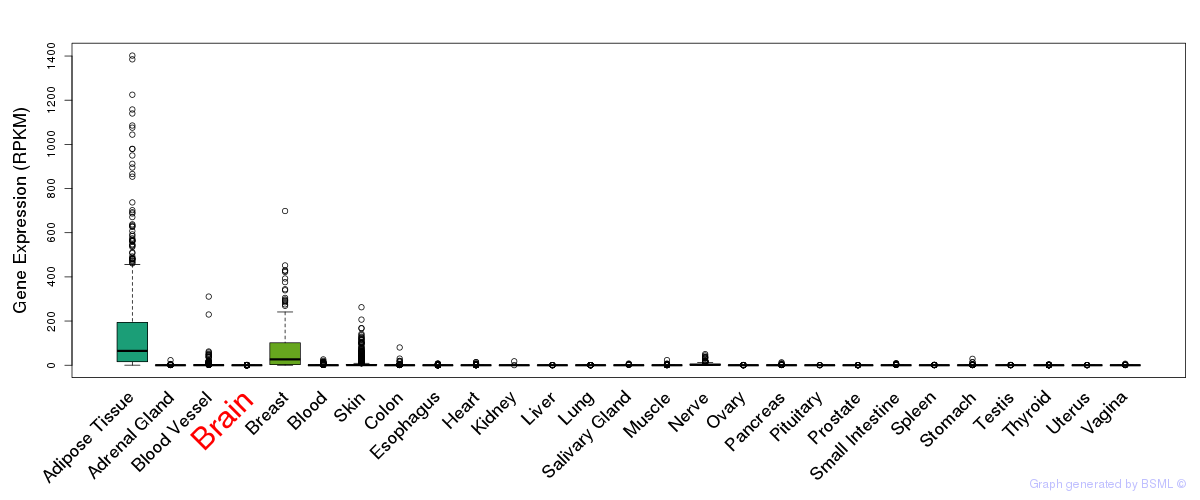
General gene expression (GTEx)
Gene expression during devlopment (BrainCloud)
Footnote:
A total of 269 time points ploted, with n=38 fetal samples (x=1:38). Each triangle represents one time point.
Gene expression of temporal and spatial changes (BrainSpan)
Footnote:
SC: sub-cortical regions; SM: sensory-motor regions; FC: frontal cortex; and TP: temporal-parietal cortex
ST1: fetal (13 - 26 postconception weeks), ST2: early infancy to late childhood (4 months to 11 years), and ST3: adolescence to adulthood (13 - 23 years)
The bar shown representes the lower 25% and upper 25% of the expression distribution.
Top co-expressed genes in brain regions
| Top 10 positively co-expressed genes | ||
| Gene | Pearson's Correlation | Spearman's Correlation |
| PTAR1 | 0.88 | 0.90 |
| ARHGAP5 | 0.86 | 0.87 |
| ITGAV | 0.86 | 0.89 |
| PIK3C2A | 0.84 | 0.88 |
| ITGB8 | 0.84 | 0.89 |
| DPY19L4 | 0.82 | 0.84 |
| QKI | 0.81 | 0.84 |
| ATL3 | 0.81 | 0.84 |
| MKLN1 | 0.79 | 0.82 |
| AP3B1 | 0.79 | 0.75 |
| Top 10 negatively co-expressed genes | ||
| Gene | Pearson's Correlation | Spearman's Correlation |
| RP9P | -0.33 | -0.48 |
| NANOS3 | -0.33 | -0.38 |
| AL022328.1 | -0.33 | -0.41 |
| HES4 | -0.33 | -0.40 |
| IL32 | -0.32 | -0.42 |
| SNHG12 | -0.32 | -0.44 |
| C9orf142 | -0.32 | -0.33 |
| ST20 | -0.32 | -0.40 |
| AC016757.1 | -0.30 | -0.34 |
| C16orf79 | -0.29 | -0.33 |
Section III. Gene Ontology annotation
| Molecular function | GO term | Evidence | Neuro keywords | PubMed ID |
|---|---|---|---|---|
| GO:0005179 | hormone activity | IEA | - | |
| GO:0005515 | protein binding | IEA | - | |
| GO:0008083 | growth factor activity | IEA | - | |
| Biological process | GO term | Evidence | Neuro keywords | PubMed ID |
| GO:0008206 | bile acid metabolic process | IEA | - | |
| GO:0006112 | energy reserve metabolic process | TAS | 9537324 | |
| GO:0006006 | glucose metabolic process | IEA | - | |
| GO:0007165 | signal transduction | IEA | - | |
| GO:0008203 | cholesterol metabolic process | IEA | - | |
| GO:0008343 | adult feeding behavior | ISS | - | |
| GO:0006629 | lipid metabolic process | IEA | - | |
| GO:0042755 | eating behavior | IEA | - | |
| GO:0019222 | regulation of metabolic process | IEA | - | |
| GO:0032099 | negative regulation of appetite | ISS | - | |
| GO:0030300 | regulation of cholesterol absorption | IEA | - | |
| GO:0045639 | positive regulation of myeloid cell differentiation | IEA | - | |
| Cellular component | GO term | Evidence | Neuro keywords | PubMed ID |
| GO:0005576 | extracellular region | IEA | - | |
| GO:0005615 | extracellular space | ISS | - |
Section V. Pathway annotation
| Pathway name | Pathway size | # SZGR 2.0 genes in pathway | Info |
|---|---|---|---|
| KEGG CYTOKINE CYTOKINE RECEPTOR INTERACTION | 267 | 161 | All SZGR 2.0 genes in this pathway |
| KEGG NEUROACTIVE LIGAND RECEPTOR INTERACTION | 272 | 195 | All SZGR 2.0 genes in this pathway |
| KEGG JAK STAT SIGNALING PATHWAY | 155 | 105 | All SZGR 2.0 genes in this pathway |
| KEGG ADIPOCYTOKINE SIGNALING PATHWAY | 67 | 57 | All SZGR 2.0 genes in this pathway |
| BIOCARTA LEPTIN PATHWAY | 11 | 11 | All SZGR 2.0 genes in this pathway |
| PID PTP1B PATHWAY | 52 | 40 | All SZGR 2.0 genes in this pathway |
| PID HIF1 TFPATHWAY | 66 | 52 | All SZGR 2.0 genes in this pathway |
| REACTOME DEVELOPMENTAL BIOLOGY | 396 | 292 | All SZGR 2.0 genes in this pathway |
| REACTOME INTEGRATION OF ENERGY METABOLISM | 120 | 84 | All SZGR 2.0 genes in this pathway |
| REACTOME DIABETES PATHWAYS | 133 | 91 | All SZGR 2.0 genes in this pathway |
| REACTOME REGULATION OF INSULIN SECRETION | 93 | 65 | All SZGR 2.0 genes in this pathway |
| REACTOME SYNTHESIS SECRETION AND DEACYLATION OF GHRELIN | 16 | 11 | All SZGR 2.0 genes in this pathway |
| REACTOME INCRETIN SYNTHESIS SECRETION AND INACTIVATION | 22 | 14 | All SZGR 2.0 genes in this pathway |
| REACTOME SYNTHESIS SECRETION AND INACTIVATION OF GLP1 | 19 | 12 | All SZGR 2.0 genes in this pathway |
| REACTOME TRANSCRIPTIONAL REGULATION OF WHITE ADIPOCYTE DIFFERENTIATION | 72 | 53 | All SZGR 2.0 genes in this pathway |
| BYSTRYKH HEMATOPOIESIS STEM CELL QTL TRANS | 882 | 572 | All SZGR 2.0 genes in this pathway |
| NADLER OBESITY UP | 61 | 34 | All SZGR 2.0 genes in this pathway |
| AFFAR YY1 TARGETS DN | 234 | 137 | All SZGR 2.0 genes in this pathway |
| MARTINEZ RB1 TARGETS UP | 673 | 430 | All SZGR 2.0 genes in this pathway |
| MARTINEZ TP53 TARGETS DN | 593 | 372 | All SZGR 2.0 genes in this pathway |
| MARTINEZ RB1 AND TP53 TARGETS UP | 601 | 369 | All SZGR 2.0 genes in this pathway |
| SMID BREAST CANCER LUMINAL A UP | 84 | 52 | All SZGR 2.0 genes in this pathway |
| SMID BREAST CANCER BASAL DN | 701 | 446 | All SZGR 2.0 genes in this pathway |
| MATZUK CENTRAL FOR FEMALE FERTILITY | 29 | 25 | All SZGR 2.0 genes in this pathway |
| CADWELL ATG16L1 TARGETS UP | 93 | 56 | All SZGR 2.0 genes in this pathway |
| WINTER HYPOXIA METAGENE | 242 | 168 | All SZGR 2.0 genes in this pathway |
| VART KSHV INFECTION ANGIOGENIC MARKERS DN | 138 | 92 | All SZGR 2.0 genes in this pathway |
| YOSHIMURA MAPK8 TARGETS UP | 1305 | 895 | All SZGR 2.0 genes in this pathway |
| YOSHIMURA MAPK8 TARGETS DN | 366 | 257 | All SZGR 2.0 genes in this pathway |
| MEISSNER NPC ICP WITH H3 UNMETHYLATED | 24 | 15 | All SZGR 2.0 genes in this pathway |
| LIU VAV3 PROSTATE CARCINOGENESIS UP | 89 | 61 | All SZGR 2.0 genes in this pathway |
| MIKKELSEN ES ICP WITH H3K27ME3 | 42 | 27 | All SZGR 2.0 genes in this pathway |
| MARTENS TRETINOIN RESPONSE UP | 857 | 456 | All SZGR 2.0 genes in this pathway |
| LIM MAMMARY STEM CELL UP | 489 | 314 | All SZGR 2.0 genes in this pathway |
| NABA SECRETED FACTORS | 344 | 197 | All SZGR 2.0 genes in this pathway |
| NABA MATRISOME ASSOCIATED | 753 | 411 | All SZGR 2.0 genes in this pathway |
| NABA MATRISOME | 1028 | 559 | All SZGR 2.0 genes in this pathway |
Section VI. microRNA annotation
| miRNA family | Target position | miRNA ID | miRNA seq | ||
|---|---|---|---|---|---|
| UTR start | UTR end | Match method | |||
| miR-29 | 1652 | 1659 | 1A,m8 | hsa-miR-29aSZ | UAGCACCAUCUGAAAUCGGUU |
| hsa-miR-29bSZ | UAGCACCAUUUGAAAUCAGUGUU | ||||
| hsa-miR-29cSZ | UAGCACCAUUUGAAAUCGGU | ||||
- SZ: miRNAs which differentially expressed in brain cortex of schizophrenia patients comparing with control samples using microarray. Click here to see the list of SZ related miRNAs.
- Brain: miRNAs which are expressed in brain based on miRNA microarray expression studies. Click here to see the list of brain related miRNAs.