Gene Page: MYO18A
Summary ?
| GeneID | 399687 |
| Symbol | MYO18A |
| Synonyms | MYSPDZ|SPR210 |
| Description | myosin XVIIIA |
| Reference | MIM:610067|HGNC:HGNC:31104|Ensembl:ENSG00000196535|HPRD:10106|Vega:OTTHUMG00000166360 |
| Gene type | protein-coding |
| Map location | 17q11.2 |
| Pascal p-value | 0.267 |
| TADA p-value | 0.03 |
| Fetal beta | -0.576 |
| eGene | Myers' cis & trans |
| Support | G2Cdb.human_BAYES-COLLINS-HUMAN-PSD-CONSENSUS G2Cdb.human_BAYES-COLLINS-HUMAN-PSD-FULL G2Cdb.human_BAYES-COLLINS-MOUSE-PSD-CONSENSUS CompositeSet Darnell FMRP targets Ascano FMRP targets |
Gene in Data Sources
| Gene set name | Method of gene set | Description | Info |
|---|---|---|---|
| CV:PGCnp | Genome-wide Association Study | GWAS | |
| DNM:Fromer_2014 | Whole Exome Sequencing analysis | This study reported a WES study of 623 schizophrenia trios, reporting DNMs using genomic DNA. |
Section I. Genetics and epigenetics annotation
 DNM table
| Gene | Chromosome | Position | Ref | Alt | Transcript | AA change | Mutation type | Sift | CG46 | Trait | Study |
|---|---|---|---|---|---|---|---|---|---|---|---|
| MYO18A | chr17 | 27425968 | C | T | NM_078471 NM_203318 | p.1219R>H p.1219R>H | missense missense | Schizophrenia | DNM:Fromer_2014 |
eQTL annotation
| SNP ID | Chromosome | Position | eGene | Gene Entrez ID | pvalue | qvalue | TSS distance | eQTL type |
|---|---|---|---|---|---|---|---|---|
| rs10994209 | chr10 | 61877705 | MYO18A | 399687 | 0.17 | trans |
Section II. Transcriptome annotation
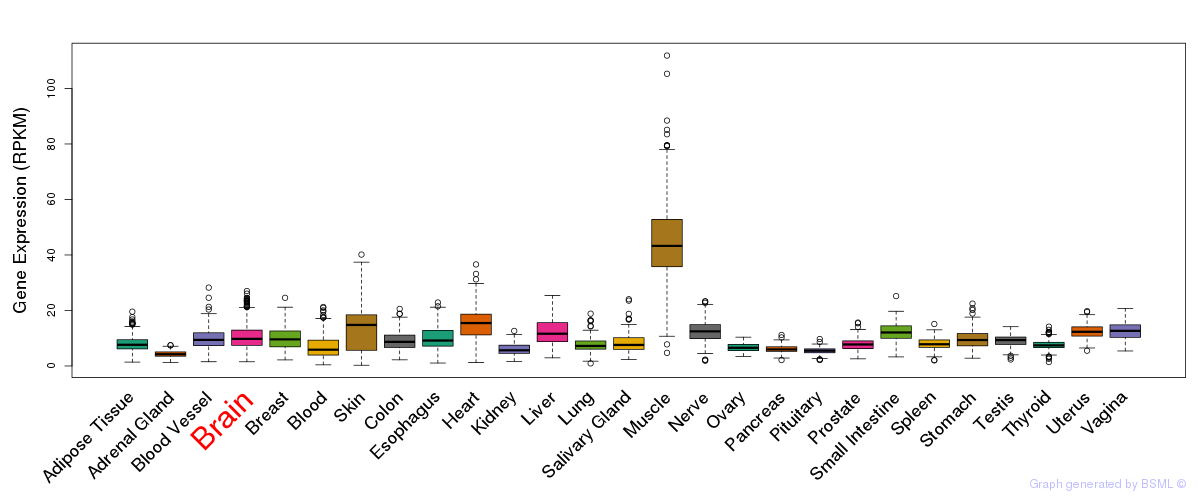
General gene expression (GTEx)
Gene expression during devlopment (BrainCloud)
Footnote:
A total of 269 time points ploted, with n=38 fetal samples (x=1:38). Each triangle represents one time point.
Gene expression of temporal and spatial changes (BrainSpan)
Footnote:
SC: sub-cortical regions; SM: sensory-motor regions; FC: frontal cortex; and TP: temporal-parietal cortex
ST1: fetal (13 - 26 postconception weeks), ST2: early infancy to late childhood (4 months to 11 years), and ST3: adolescence to adulthood (13 - 23 years)
The bar shown representes the lower 25% and upper 25% of the expression distribution.
No co-expressed genes in brain regions
Section V. Pathway annotation
| Pathway name | Pathway size | # SZGR 2.0 genes in pathway | Info |
|---|---|---|---|
| REACTOME SIGNALING BY FGFR IN DISEASE | 127 | 88 | All SZGR 2.0 genes in this pathway |
| REACTOME SIGNALING BY FGFR1 MUTANTS | 30 | 20 | All SZGR 2.0 genes in this pathway |
| REACTOME SIGNALING BY FGFR1 FUSION MUTANTS | 19 | 12 | All SZGR 2.0 genes in this pathway |
| REACTOME SIGNALING BY FGFR MUTANTS | 44 | 29 | All SZGR 2.0 genes in this pathway |
| NIKOLSKY BREAST CANCER 17Q11 Q21 AMPLICON | 133 | 78 | All SZGR 2.0 genes in this pathway |
| CUI TCF21 TARGETS 2 DN | 830 | 547 | All SZGR 2.0 genes in this pathway |
| ACEVEDO NORMAL TISSUE ADJACENT TO LIVER TUMOR UP | 174 | 96 | All SZGR 2.0 genes in this pathway |
| HAN SATB1 TARGETS UP | 395 | 249 | All SZGR 2.0 genes in this pathway |
| WANG RESPONSE TO GSK3 INHIBITOR SB216763 UP | 397 | 206 | All SZGR 2.0 genes in this pathway |
| FEVR CTNNB1 TARGETS UP | 682 | 433 | All SZGR 2.0 genes in this pathway |
| GOBERT OLIGODENDROCYTE DIFFERENTIATION DN | 1080 | 713 | All SZGR 2.0 genes in this pathway |
| FORTSCHEGGER PHF8 TARGETS DN | 784 | 464 | All SZGR 2.0 genes in this pathway |