Gene Page: SERTM1
Summary ?
| GeneID | 400120 |
| Symbol | SERTM1 |
| Synonyms | C13orf36 |
| Description | serine rich and transmembrane domain containing 1 |
| Reference | HGNC:HGNC:33792|Ensembl:ENSG00000180440|HPRD:14219|Vega:OTTHUMG00000016735 |
| Gene type | protein-coding |
| Map location | 13q13.3 |
| Pascal p-value | 0.905 |
| Fetal beta | -2.475 |
| eGene | Putamen basal ganglia |
Gene in Data Sources
| Gene set name | Method of gene set | Description | Info |
|---|---|---|---|
| CV:GWASdb | Genome-wide Association Studies | GWASdb records for schizophrenia | |
| CV:PGCnp | Genome-wide Association Study | GWAS |
Section I. Genetics and epigenetics annotation
 eQTL annotation
| SNP ID | Chromosome | Position | eGene | Gene Entrez ID | pvalue | qvalue | TSS distance | eQTL type |
|---|---|---|---|---|---|---|---|---|
| rs12428026 | chr13 | 30107962 | C13orf36 | 400120 | 0.09 | trans | ||
| rs3011605 | chr13 | 30111727 | C13orf36 | 400120 | 0.03 | trans | ||
| rs2989594 | chr13 | 30111749 | C13orf36 | 400120 | 0.02 | trans | ||
| rs476506 | chr13 | 30138035 | C13orf36 | 400120 | 0.04 | trans | ||
| rs1877463 | chr13 | 30147595 | C13orf36 | 400120 | 0.07 | trans | ||
| rs280933 | chr13 | 30154545 | C13orf36 | 400120 | 0.01 | trans | ||
| rs280936 | chr13 | 30156316 | C13orf36 | 400120 | 0.01 | trans | ||
| rs166828 | chr13 | 30157038 | C13orf36 | 400120 | 0.01 | trans | ||
| rs9602618 | 13 | 36838074 | SERTM1 | ENSG00000180440.3 | 2.20289E-7 | 0.01 | -409975 | gtex_brain_putamen_basal |
Section II. Transcriptome annotation
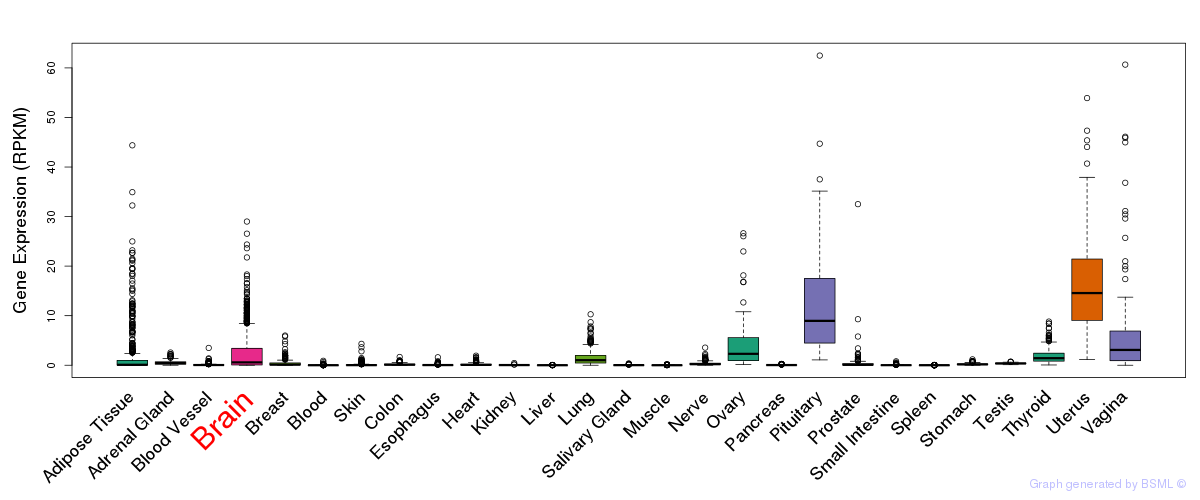
General gene expression (GTEx)
Gene expression during devlopment (BrainCloud)
Footnote:
A total of 269 time points ploted, with n=38 fetal samples (x=1:38). Each triangle represents one time point.
Gene expression of temporal and spatial changes (BrainSpan)
Footnote:
SC: sub-cortical regions; SM: sensory-motor regions; FC: frontal cortex; and TP: temporal-parietal cortex
ST1: fetal (13 - 26 postconception weeks), ST2: early infancy to late childhood (4 months to 11 years), and ST3: adolescence to adulthood (13 - 23 years)
The bar shown representes the lower 25% and upper 25% of the expression distribution.
No co-expressed genes in brain regions
Section V. Pathway annotation
| Pathway name | Pathway size | # SZGR 2.0 genes in pathway | Info |
|---|---|---|---|
| RODRIGUES THYROID CARCINOMA ANAPLASTIC DN | 537 | 339 | All SZGR 2.0 genes in this pathway |
| BENPORATH SUZ12 TARGETS | 1038 | 678 | All SZGR 2.0 genes in this pathway |
| BENPORATH EED TARGETS | 1062 | 725 | All SZGR 2.0 genes in this pathway |
| BENPORATH ES WITH H3K27ME3 | 1118 | 744 | All SZGR 2.0 genes in this pathway |
| BENPORATH PRC2 TARGETS | 652 | 441 | All SZGR 2.0 genes in this pathway |
| MEISSNER BRAIN HCP WITH H3K4ME3 AND H3K27ME3 | 1069 | 729 | All SZGR 2.0 genes in this pathway |
| MIKKELSEN MEF HCP WITH H3K27ME3 | 590 | 403 | All SZGR 2.0 genes in this pathway |