Gene Page: ADAM11
Summary ?
| GeneID | 4185 |
| Symbol | ADAM11 |
| Synonyms | MDC |
| Description | ADAM metallopeptidase domain 11 |
| Reference | MIM:155120|HGNC:HGNC:189|Ensembl:ENSG00000073670|HPRD:01114|Vega:OTTHUMG00000179038 |
| Gene type | protein-coding |
| Map location | 17q21.3 |
| Pascal p-value | 0.007 |
| Fetal beta | -0.844 |
| DMG | 1 (# studies) |
| eGene | Cerebellum Myers' cis & trans |
| Support | G2Cdb.human_BAYES-COLLINS-MOUSE-PSD-CONSENSUS |
Gene in Data Sources
| Gene set name | Method of gene set | Description | Info |
|---|---|---|---|
| CV:PGCnp | Genome-wide Association Study | GWAS | |
| DMG:Wockner_2014 | Genome-wide DNA methylation analysis | This dataset includes 4641 differentially methylated probes corresponding to 2929 unique genes between schizophrenia patients (n=24) and controls (n=24). | 1 |
Section I. Genetics and epigenetics annotation
 Differentially methylated gene
| Probe | Chromosome | Position | Nearest gene | P (dis) | Beta (dis) | FDR (dis) | Study |
|---|---|---|---|---|---|---|---|
| cg26050159 | 17 | 42837242 | ADAM11 | 5.624E-4 | 0.321 | 0.049 | DMG:Wockner_2014 |
eQTL annotation
| SNP ID | Chromosome | Position | eGene | Gene Entrez ID | pvalue | qvalue | TSS distance | eQTL type |
|---|---|---|---|---|---|---|---|---|
| rs16869851 | chr4 | 20690056 | ADAM11 | 4185 | 0.1 | trans |
Section II. Transcriptome annotation
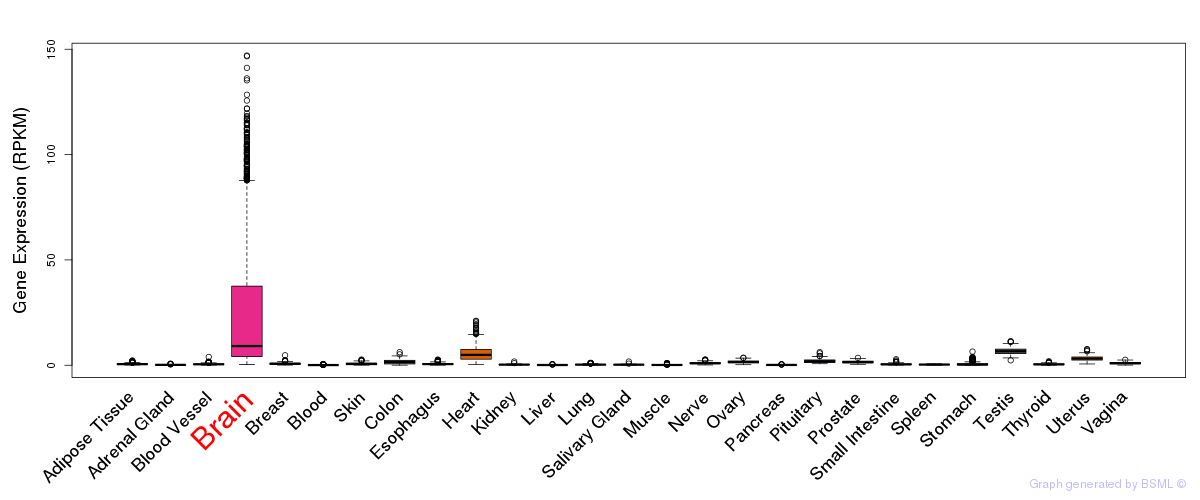
General gene expression (GTEx)
Gene expression during devlopment (BrainCloud)
Footnote:
A total of 269 time points ploted, with n=38 fetal samples (x=1:38). Each triangle represents one time point.
Gene expression of temporal and spatial changes (BrainSpan)
Footnote:
SC: sub-cortical regions; SM: sensory-motor regions; FC: frontal cortex; and TP: temporal-parietal cortex
ST1: fetal (13 - 26 postconception weeks), ST2: early infancy to late childhood (4 months to 11 years), and ST3: adolescence to adulthood (13 - 23 years)
The bar shown representes the lower 25% and upper 25% of the expression distribution.
Top co-expressed genes in brain regions
| Top 10 positively co-expressed genes | ||
| Gene | Pearson's Correlation | Spearman's Correlation |
| CALHM1 | 0.72 | 0.53 |
| KCNK1 | 0.70 | 0.57 |
| AQP9 | 0.70 | 0.60 |
| RASGRF2 | 0.70 | 0.56 |
| MCHR1 | 0.70 | 0.56 |
| MFSD4 | 0.70 | 0.56 |
| C12orf64 | 0.69 | 0.57 |
| MAST3 | 0.69 | 0.55 |
| TYRO3 | 0.69 | 0.52 |
| BMPER | 0.69 | 0.56 |
| Top 10 negatively co-expressed genes | ||
| Gene | Pearson's Correlation | Spearman's Correlation |
| BCL7C | -0.39 | -0.48 |
| C9orf46 | -0.38 | -0.45 |
| GTF3C6 | -0.37 | -0.39 |
| TRAF4 | -0.36 | -0.45 |
| AC006276.2 | -0.36 | -0.44 |
| PKN1 | -0.36 | -0.38 |
| FAM36A | -0.36 | -0.34 |
| HEBP2 | -0.36 | -0.50 |
| C6orf48 | -0.36 | -0.42 |
| TUBB2B | -0.36 | -0.42 |
Section V. Pathway annotation
| Pathway name | Pathway size | # SZGR 2.0 genes in pathway | Info |
|---|---|---|---|
| BERTUCCI INVASIVE CARCINOMA DUCTAL VS LOBULAR DN | 46 | 34 | All SZGR 2.0 genes in this pathway |
| MOREAUX MULTIPLE MYELOMA BY TACI UP | 412 | 249 | All SZGR 2.0 genes in this pathway |
| KYNG DNA DAMAGE BY 4NQO OR UV | 63 | 44 | All SZGR 2.0 genes in this pathway |
| KYNG DNA DAMAGE UP | 226 | 164 | All SZGR 2.0 genes in this pathway |
| ACEVEDO METHYLATED IN LIVER CANCER DN | 940 | 425 | All SZGR 2.0 genes in this pathway |
| MEISSNER NPC HCP WITH H3K4ME2 | 491 | 319 | All SZGR 2.0 genes in this pathway |
| MIKKELSEN MEF HCP WITH H3K27ME3 | 590 | 403 | All SZGR 2.0 genes in this pathway |
| ZWANG TRANSIENTLY UP BY 2ND EGF PULSE ONLY | 1725 | 838 | All SZGR 2.0 genes in this pathway |
| NABA ECM REGULATORS | 238 | 125 | All SZGR 2.0 genes in this pathway |
| NABA MATRISOME ASSOCIATED | 753 | 411 | All SZGR 2.0 genes in this pathway |
| NABA MATRISOME | 1028 | 559 | All SZGR 2.0 genes in this pathway |