Gene Page: REG3A
Summary ?
| GeneID | 5068 |
| Symbol | REG3A |
| Synonyms | HIP|HIP/PAP|INGAP|PAP|PAP-H|PAP1|PBCGF|REG-III|REG3 |
| Description | regenerating family member 3 alpha |
| Reference | MIM:167805|HGNC:HGNC:8601|Ensembl:ENSG00000172016|HPRD:01342|Vega:OTTHUMG00000130017 |
| Gene type | protein-coding |
| Map location | 2p12 |
| Pascal p-value | 0.005 |
| Fetal beta | -0.501 |
Gene in Data Sources
| Gene set name | Method of gene set | Description | Info |
|---|---|---|---|
| CV:GWASdb | Genome-wide Association Studies | GWASdb records for schizophrenia | |
| CV:PGCnp | Genome-wide Association Study | GWAS |
Section I. Genetics and epigenetics annotation
Section II. Transcriptome annotation
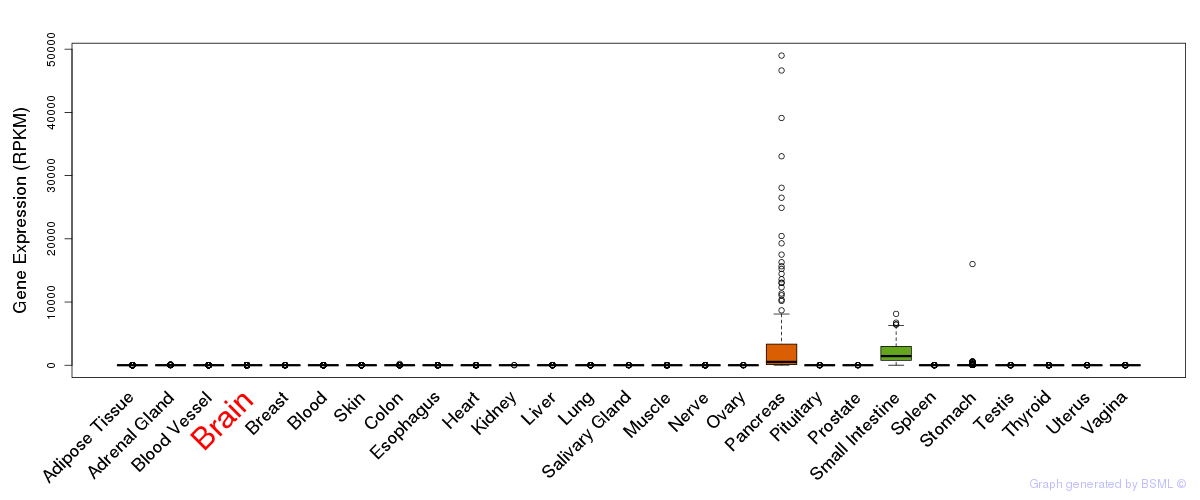
General gene expression (GTEx)
Gene expression during devlopment (BrainCloud)
Footnote:
A total of 269 time points ploted, with n=38 fetal samples (x=1:38). Each triangle represents one time point.
Gene expression of temporal and spatial changes (BrainSpan)
Footnote:
SC: sub-cortical regions; SM: sensory-motor regions; FC: frontal cortex; and TP: temporal-parietal cortex
ST1: fetal (13 - 26 postconception weeks), ST2: early infancy to late childhood (4 months to 11 years), and ST3: adolescence to adulthood (13 - 23 years)
The bar shown representes the lower 25% and upper 25% of the expression distribution.
Top co-expressed genes in brain regions
| Top 10 positively co-expressed genes | ||
| Gene | Pearson's Correlation | Spearman's Correlation |
| ZSCAN18 | 0.75 | 0.81 |
| CABC1 | 0.72 | 0.77 |
| PGBD5 | 0.71 | 0.77 |
| ELK1 | 0.71 | 0.73 |
| USP11 | 0.71 | 0.76 |
| FBXO31 | 0.69 | 0.75 |
| DENND1A | 0.69 | 0.75 |
| ARNT2 | 0.69 | 0.73 |
| PCDHGC5 | 0.69 | 0.73 |
| KLHL26 | 0.68 | 0.74 |
| Top 10 negatively co-expressed genes | ||
| Gene | Pearson's Correlation | Spearman's Correlation |
| AF347015.21 | -0.52 | -0.51 |
| MT-CO2 | -0.51 | -0.49 |
| AF347015.8 | -0.48 | -0.47 |
| AF347015.31 | -0.48 | -0.47 |
| AF347015.2 | -0.47 | -0.42 |
| AF347015.33 | -0.47 | -0.44 |
| MT-CYB | -0.47 | -0.44 |
| AC098691.2 | -0.46 | -0.50 |
| NOSTRIN | -0.46 | -0.47 |
| AF347015.26 | -0.46 | -0.42 |
Section V. Pathway annotation
| Pathway name | Pathway size | # SZGR 2.0 genes in pathway | Info |
|---|---|---|---|
| GAZDA DIAMOND BLACKFAN ANEMIA ERYTHROID DN | 493 | 298 | All SZGR 2.0 genes in this pathway |
| VECCHI GASTRIC CANCER ADVANCED VS EARLY DN | 138 | 70 | All SZGR 2.0 genes in this pathway |
| SABATES COLORECTAL ADENOMA UP | 141 | 75 | All SZGR 2.0 genes in this pathway |
| PEREZ TP63 TARGETS | 355 | 243 | All SZGR 2.0 genes in this pathway |
| CAVARD LIVER CANCER MALIGNANT VS BENIGN | 32 | 19 | All SZGR 2.0 genes in this pathway |
| XU HGF TARGETS REPRESSED BY AKT1 DN | 95 | 58 | All SZGR 2.0 genes in this pathway |
| GRUETZMANN PANCREATIC CANCER DN | 203 | 134 | All SZGR 2.0 genes in this pathway |
| HOWLIN PUBERTAL MAMMARY GLAND | 69 | 40 | All SZGR 2.0 genes in this pathway |
| POMEROY MEDULLOBLASTOMA PROGNOSIS UP | 47 | 30 | All SZGR 2.0 genes in this pathway |
| IGLESIAS E2F TARGETS DN | 16 | 11 | All SZGR 2.0 genes in this pathway |
| LEE AGING NEOCORTEX DN | 80 | 49 | All SZGR 2.0 genes in this pathway |
| LEE AGING CEREBELLUM DN | 86 | 66 | All SZGR 2.0 genes in this pathway |
| BLALOCK ALZHEIMERS DISEASE UP | 1691 | 1088 | All SZGR 2.0 genes in this pathway |
| YANG MUC2 TARGETS DUODENUM 6MO UP | 10 | 5 | All SZGR 2.0 genes in this pathway |
| ZHENG IL22 SIGNALING UP | 56 | 36 | All SZGR 2.0 genes in this pathway |
| BOYAULT LIVER CANCER SUBCLASS G56 UP | 12 | 9 | All SZGR 2.0 genes in this pathway |
| CHIANG LIVER CANCER SUBCLASS CTNNB1 UP | 176 | 110 | All SZGR 2.0 genes in this pathway |
| FEVR CTNNB1 TARGETS UP | 682 | 433 | All SZGR 2.0 genes in this pathway |
| ACEVEDO FGFR1 TARGETS IN PROSTATE CANCER MODEL UP | 289 | 184 | All SZGR 2.0 genes in this pathway |
| NABA ECM AFFILIATED | 171 | 89 | All SZGR 2.0 genes in this pathway |
| NABA MATRISOME ASSOCIATED | 753 | 411 | All SZGR 2.0 genes in this pathway |
| NABA MATRISOME | 1028 | 559 | All SZGR 2.0 genes in this pathway |