Gene Page: PCDH1
Summary ?
| GeneID | 5097 |
| Symbol | PCDH1 |
| Synonyms | PC42|PCDH42 |
| Description | protocadherin 1 |
| Reference | MIM:603626|HGNC:HGNC:8655|Ensembl:ENSG00000156453|HPRD:04692|Vega:OTTHUMG00000129661 |
| Gene type | protein-coding |
| Map location | 5q31.3 |
| Pascal p-value | 9.756E-4 |
| Sherlock p-value | 0.581 |
| Fetal beta | -1.272 |
| DMG | 1 (# studies) |
| eGene | Myers' cis & trans |
| Support | CELL ADHESION AND TRANSSYNAPTIC SIGNALING G2Cdb.human_BAYES-COLLINS-HUMAN-PSD-FULL CompositeSet Darnell FMRP targets |
Gene in Data Sources
| Gene set name | Method of gene set | Description | Info |
|---|---|---|---|
| CV:PGCnp | Genome-wide Association Study | GWAS | |
| DMG:Wockner_2014 | Genome-wide DNA methylation analysis | This dataset includes 4641 differentially methylated probes corresponding to 2929 unique genes between schizophrenia patients (n=24) and controls (n=24). | 1 |
| PMID:cooccur | High-throughput literature-search | Systematic search in PubMed for genes co-occurring with SCZ keywords. A total of 3027 genes were included. | |
| GSMA_I | Genome scan meta-analysis | Psr: 0.0032 | |
| Literature | High-throughput literature-search | Co-occurance with Schizophrenia keywords: schizophrenia,schizophrenias | Click to show details |
| GO_Annotation | Mapping neuro-related keywords to Gene Ontology annotations | Hits with neuro-related keywords: 1 |
Section I. Genetics and epigenetics annotation
 Differentially methylated gene
| Probe | Chromosome | Position | Nearest gene | P (dis) | Beta (dis) | FDR (dis) | Study |
|---|---|---|---|---|---|---|---|
| cg15646543 | 5 | 141242687 | PCDH1 | 4.68E-5 | 0.405 | 0.021 | DMG:Wockner_2014 |
eQTL annotation
| SNP ID | Chromosome | Position | eGene | Gene Entrez ID | pvalue | qvalue | TSS distance | eQTL type |
|---|---|---|---|---|---|---|---|---|
| rs10872225 | chr6 | 121979967 | PCDH1 | 5097 | 0.11 | trans | ||
| rs7132043 | chr12 | 80968399 | PCDH1 | 5097 | 0.1 | trans |
Section II. Transcriptome annotation
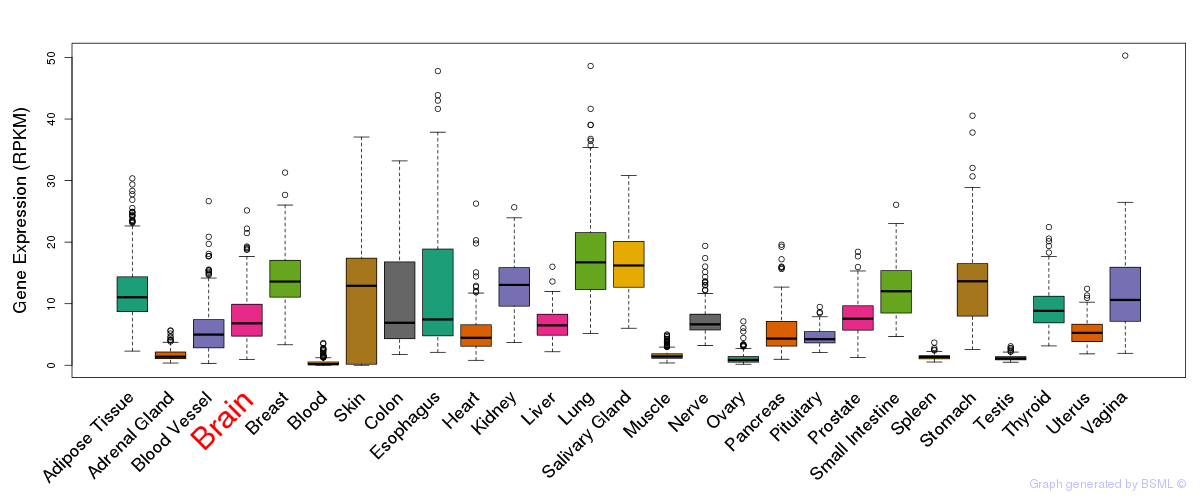
General gene expression (GTEx)
Gene expression during devlopment (BrainCloud)
Footnote:
A total of 269 time points ploted, with n=38 fetal samples (x=1:38). Each triangle represents one time point.
Gene expression of temporal and spatial changes (BrainSpan)
Footnote:
SC: sub-cortical regions; SM: sensory-motor regions; FC: frontal cortex; and TP: temporal-parietal cortex
ST1: fetal (13 - 26 postconception weeks), ST2: early infancy to late childhood (4 months to 11 years), and ST3: adolescence to adulthood (13 - 23 years)
The bar shown representes the lower 25% and upper 25% of the expression distribution.
Top co-expressed genes in brain regions
| Top 10 positively co-expressed genes | ||
| Gene | Pearson's Correlation | Spearman's Correlation |
| ATPGD1 | 0.95 | 0.93 |
| SEMA3B | 0.95 | 0.89 |
| PLXNB3 | 0.94 | 0.92 |
| TMEM63A | 0.93 | 0.94 |
| GSN | 0.93 | 0.93 |
| FA2H | 0.93 | 0.94 |
| LDB3 | 0.93 | 0.92 |
| TMC6 | 0.93 | 0.91 |
| SLC5A11 | 0.93 | 0.91 |
| C11orf9 | 0.92 | 0.92 |
| Top 10 negatively co-expressed genes | ||
| Gene | Pearson's Correlation | Spearman's Correlation |
| NKIRAS2 | -0.58 | -0.68 |
| NR2C2AP | -0.57 | -0.77 |
| IFT52 | -0.57 | -0.76 |
| TRNAU1AP | -0.57 | -0.75 |
| POLB | -0.57 | -0.77 |
| STMN1 | -0.57 | -0.77 |
| ALKBH2 | -0.57 | -0.77 |
| MED19 | -0.57 | -0.75 |
| HN1 | -0.57 | -0.74 |
| RARS2 | -0.57 | -0.75 |
Section III. Gene Ontology annotation
| Molecular function | GO term | Evidence | Neuro keywords | PubMed ID |
|---|---|---|---|---|
| GO:0005509 | calcium ion binding | IEA | - | |
| GO:0005515 | protein binding | IEA | - | |
| Biological process | GO term | Evidence | Neuro keywords | PubMed ID |
| GO:0007399 | nervous system development | TAS | neurite (GO term level: 5) | 8508762 |
| GO:0007155 | cell adhesion | IEA | - | |
| GO:0007156 | homophilic cell adhesion | IEA | - | |
| GO:0007267 | cell-cell signaling | TAS | 8508762 | |
| Cellular component | GO term | Evidence | Neuro keywords | PubMed ID |
| GO:0005911 | cell-cell junction | TAS | 8508762 | |
| GO:0005886 | plasma membrane | TAS | 8508762 | |
| GO:0005887 | integral to plasma membrane | TAS | 8508762 |
Section V. Pathway annotation
| Pathway name | Pathway size | # SZGR 2.0 genes in pathway | Info |
|---|---|---|---|
| CHARAFE BREAST CANCER LUMINAL VS MESENCHYMAL UP | 450 | 256 | All SZGR 2.0 genes in this pathway |
| RODRIGUES NTN1 TARGETS DN | 158 | 102 | All SZGR 2.0 genes in this pathway |
| DODD NASOPHARYNGEAL CARCINOMA UP | 1821 | 933 | All SZGR 2.0 genes in this pathway |
| BENPORATH ES 1 | 379 | 235 | All SZGR 2.0 genes in this pathway |
| TARTE PLASMA CELL VS PLASMABLAST UP | 398 | 262 | All SZGR 2.0 genes in this pathway |
| PETROVA ENDOTHELIUM LYMPHATIC VS BLOOD DN | 162 | 102 | All SZGR 2.0 genes in this pathway |
| MOREAUX MULTIPLE MYELOMA BY TACI UP | 412 | 249 | All SZGR 2.0 genes in this pathway |
| IVANOVA HEMATOPOIESIS STEM CELL LONG TERM | 302 | 191 | All SZGR 2.0 genes in this pathway |
| MEDINA SMARCA4 TARGETS | 44 | 29 | All SZGR 2.0 genes in this pathway |
| BROWNE HCMV INFECTION 48HR DN | 504 | 323 | All SZGR 2.0 genes in this pathway |
| KYNG DNA DAMAGE BY 4NQO OR UV | 63 | 44 | All SZGR 2.0 genes in this pathway |
| KYNG DNA DAMAGE UP | 226 | 164 | All SZGR 2.0 genes in this pathway |
| GRADE COLON CANCER UP | 871 | 505 | All SZGR 2.0 genes in this pathway |
| MILI PSEUDOPODIA CHEMOTAXIS DN | 457 | 302 | All SZGR 2.0 genes in this pathway |
| MILI PSEUDOPODIA HAPTOTAXIS DN | 668 | 419 | All SZGR 2.0 genes in this pathway |
| COULOUARN TEMPORAL TGFB1 SIGNATURE DN | 138 | 99 | All SZGR 2.0 genes in this pathway |
| ZEMBUTSU SENSITIVITY TO CISPLATIN | 20 | 14 | All SZGR 2.0 genes in this pathway |
| ZEMBUTSU SENSITIVITY TO MITOMYCIN | 19 | 11 | All SZGR 2.0 genes in this pathway |
| MARTENS TRETINOIN RESPONSE UP | 857 | 456 | All SZGR 2.0 genes in this pathway |
| DUTERTRE ESTRADIOL RESPONSE 24HR DN | 505 | 328 | All SZGR 2.0 genes in this pathway |
| KOINUMA TARGETS OF SMAD2 OR SMAD3 | 824 | 528 | All SZGR 2.0 genes in this pathway |
Section VI. microRNA annotation
| miRNA family | Target position | miRNA ID | miRNA seq | ||
|---|---|---|---|---|---|
| UTR start | UTR end | Match method | |||
| miR-504 | 162 | 168 | m8 | hsa-miR-504 | AGACCCUGGUCUGCACUCUAU |
- SZ: miRNAs which differentially expressed in brain cortex of schizophrenia patients comparing with control samples using microarray. Click here to see the list of SZ related miRNAs.
- Brain: miRNAs which are expressed in brain based on miRNA microarray expression studies. Click here to see the list of brain related miRNAs.