Gene Page: PCSK2
Summary ?
| GeneID | 5126 |
| Symbol | PCSK2 |
| Synonyms | NEC 2|NEC-2|NEC2|PC2|SPC2 |
| Description | proprotein convertase subtilisin/kexin type 2 |
| Reference | MIM:162151|HGNC:HGNC:8744|Ensembl:ENSG00000125851|HPRD:01202|Vega:OTTHUMG00000031941 |
| Gene type | protein-coding |
| Map location | 20p11.2 |
| Pascal p-value | 0.087 |
| Sherlock p-value | 0.728 |
| Fetal beta | -2.396 |
| DMG | 1 (# studies) |
| Support | NEUROTROPHIN SIGNALING |
Gene in Data Sources
| Gene set name | Method of gene set | Description | Info |
|---|---|---|---|
| CV:GWASdb | Genome-wide Association Studies | GWASdb records for schizophrenia | |
| CV:PGCnp | Genome-wide Association Study | GWAS | |
| DMG:Jaffe_2016 | Genome-wide DNA methylation analysis | This dataset includes 2,104 probes/CpGs associated with SZ patients (n=108) compared to 136 controls at Bonferroni-adjusted P < 0.05. | 1 |
| GSMA_I | Genome scan meta-analysis | Psr: 0.046 | |
| GO_Annotation | Mapping neuro-related keywords to Gene Ontology annotations | Hits with neuro-related keywords: 2 |
Section I. Genetics and epigenetics annotation
 Differentially methylated gene
| Probe | Chromosome | Position | Nearest gene | P (dis) | Beta (dis) | FDR (dis) | Study |
|---|---|---|---|---|---|---|---|
| cg02706653 | 20 | 17208584 | PCSK2 | 7.21E-10 | -0.022 | 9.89E-7 | DMG:Jaffe_2016 |
Section II. Transcriptome annotation
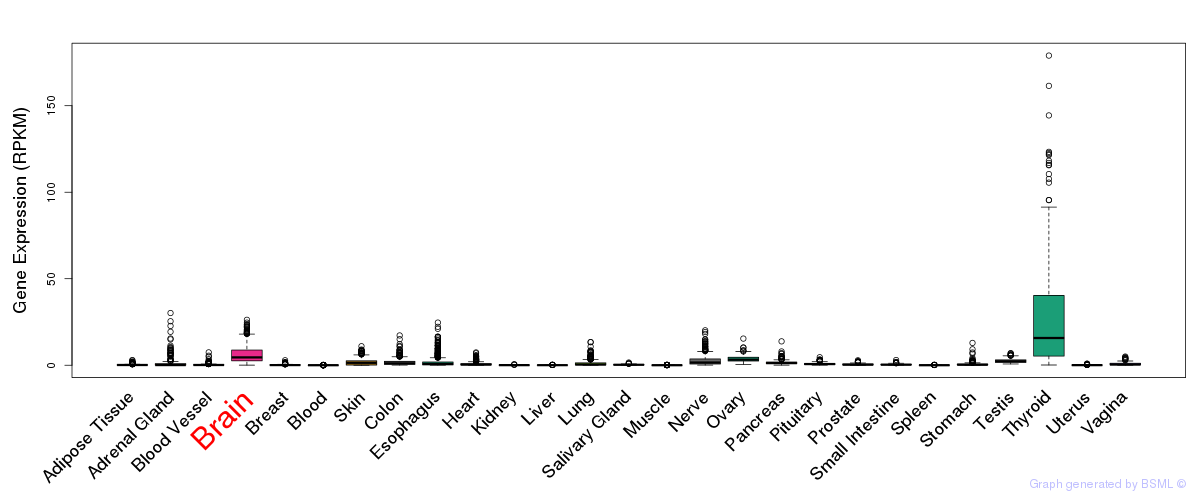
General gene expression (GTEx)
Gene expression during devlopment (BrainCloud)
Footnote:
A total of 269 time points ploted, with n=38 fetal samples (x=1:38). Each triangle represents one time point.
Gene expression of temporal and spatial changes (BrainSpan)
Footnote:
SC: sub-cortical regions; SM: sensory-motor regions; FC: frontal cortex; and TP: temporal-parietal cortex
ST1: fetal (13 - 26 postconception weeks), ST2: early infancy to late childhood (4 months to 11 years), and ST3: adolescence to adulthood (13 - 23 years)
The bar shown representes the lower 25% and upper 25% of the expression distribution.
Top co-expressed genes in brain regions
| Top 10 positively co-expressed genes | ||
| Gene | Pearson's Correlation | Spearman's Correlation |
| TJAP1 | 0.78 | 0.79 |
| DNHD1 | 0.77 | 0.80 |
| PHLDB1 | 0.72 | 0.70 |
| KIAA1755 | 0.71 | 0.62 |
| TBC1D2 | 0.70 | 0.72 |
| PLEKHG3 | 0.69 | 0.64 |
| SLC45A3 | 0.68 | 0.68 |
| CC2D1B | 0.68 | 0.71 |
| MYO15B | 0.68 | 0.66 |
| MYO15B | 0.67 | 0.69 |
| Top 10 negatively co-expressed genes | ||
| Gene | Pearson's Correlation | Spearman's Correlation |
| CARD16 | -0.37 | -0.35 |
| CAPZA2 | -0.36 | -0.36 |
| BRP44 | -0.36 | -0.40 |
| SNX3 | -0.34 | -0.33 |
| NGB | -0.34 | -0.36 |
| COMMD7 | -0.34 | -0.35 |
| GPR160 | -0.34 | -0.38 |
| PPEF1 | -0.32 | -0.24 |
| B4GALT2 | -0.32 | -0.30 |
| NPPA | -0.31 | -0.31 |
Section III. Gene Ontology annotation
| Molecular function | GO term | Evidence | Neuro keywords | PubMed ID |
|---|---|---|---|---|
| GO:0004252 | serine-type endopeptidase activity | IEA | glutamate (GO term level: 7) | - |
| GO:0005515 | protein binding | IPI | 7913882 | |
| GO:0008233 | peptidase activity | IEA | - | |
| Biological process | GO term | Evidence | Neuro keywords | PubMed ID |
| GO:0007399 | nervous system development | IEA | neurite (GO term level: 5) | - |
| GO:0006508 | proteolysis | IEA | - | |
| GO:0034230 | enkephalin processing | ISS | - | |
| GO:0034231 | islet amyloid polypeptide processing | ISS | - | |
| GO:0016540 | protein autoprocessing | IEA | - | |
| GO:0030070 | insulin processing | IDA | 7626024 | |
| Cellular component | GO term | Evidence | Neuro keywords | PubMed ID |
| GO:0005615 | extracellular space | IDA | 9020868 | |
| GO:0005625 | soluble fraction | IDA | 8034613 | |
| GO:0016020 | membrane | IDA | 8034613 | |
| GO:0031410 | cytoplasmic vesicle | IEA | - |
Section V. Pathway annotation
| Pathway name | Pathway size | # SZGR 2.0 genes in pathway | Info |
|---|---|---|---|
| REACTOME DIABETES PATHWAYS | 133 | 91 | All SZGR 2.0 genes in this pathway |
| REACTOME INSULIN SYNTHESIS AND PROCESSING | 21 | 15 | All SZGR 2.0 genes in this pathway |
| JAEGER METASTASIS DN | 258 | 141 | All SZGR 2.0 genes in this pathway |
| DELYS THYROID CANCER UP | 443 | 294 | All SZGR 2.0 genes in this pathway |
| WATTEL AUTONOMOUS THYROID ADENOMA UP | 73 | 47 | All SZGR 2.0 genes in this pathway |
| GARCIA TARGETS OF FLI1 AND DAX1 DN | 176 | 104 | All SZGR 2.0 genes in this pathway |
| BENPORATH ES WITH H3K27ME3 | 1118 | 744 | All SZGR 2.0 genes in this pathway |
| ASTON MAJOR DEPRESSIVE DISORDER DN | 160 | 110 | All SZGR 2.0 genes in this pathway |
| BLALOCK ALZHEIMERS DISEASE DN | 1237 | 837 | All SZGR 2.0 genes in this pathway |
| WANG LSD1 TARGETS DN | 39 | 30 | All SZGR 2.0 genes in this pathway |
| RIGGI EWING SARCOMA PROGENITOR UP | 430 | 288 | All SZGR 2.0 genes in this pathway |
| MASRI RESISTANCE TO TAMOXIFEN AND AROMATASE INHIBITORS DN | 20 | 11 | All SZGR 2.0 genes in this pathway |
| WEST ADRENOCORTICAL TUMOR DN | 546 | 362 | All SZGR 2.0 genes in this pathway |
| LIN NPAS4 TARGETS UP | 163 | 100 | All SZGR 2.0 genes in this pathway |
| MIKKELSEN NPC HCP WITH H3K4ME3 AND H3K27ME3 | 210 | 148 | All SZGR 2.0 genes in this pathway |
| ROLEF GLIS3 TARGETS | 37 | 29 | All SZGR 2.0 genes in this pathway |
Section VI. microRNA annotation
| miRNA family | Target position | miRNA ID | miRNA seq | ||
|---|---|---|---|---|---|
| UTR start | UTR end | Match method | |||
| miR-138 | 706 | 712 | m8 | hsa-miR-138brain | AGCUGGUGUUGUGAAUC |
| miR-200bc/429 | 2288 | 2295 | 1A,m8 | hsa-miR-200b | UAAUACUGCCUGGUAAUGAUGAC |
| hsa-miR-200c | UAAUACUGCCGGGUAAUGAUGG | ||||
| hsa-miR-429 | UAAUACUGUCUGGUAAAACCGU | ||||
| miR-203.1 | 1760 | 1766 | 1A | hsa-miR-203 | UGAAAUGUUUAGGACCACUAG |
| miR-299-5p | 1711 | 1717 | 1A | hsa-miR-299-5p | UGGUUUACCGUCCCACAUACAU |
| miR-329 | 1924 | 1930 | 1A | hsa-miR-329brain | AACACACCUGGUUAACCUCUUU |
| miR-9 | 1787 | 1793 | m8 | hsa-miR-9SZ | UCUUUGGUUAUCUAGCUGUAUGA |
- SZ: miRNAs which differentially expressed in brain cortex of schizophrenia patients comparing with control samples using microarray. Click here to see the list of SZ related miRNAs.
- Brain: miRNAs which are expressed in brain based on miRNA microarray expression studies. Click here to see the list of brain related miRNAs.