Gene Page: DCAF16
Summary ?
| GeneID | 54876 |
| Symbol | DCAF16 |
| Synonyms | C4orf30 |
| Description | DDB1 and CUL4 associated factor 16 |
| Reference | HGNC:HGNC:25987|Ensembl:ENSG00000163257|HPRD:07891|Vega:OTTHUMG00000128536 |
| Gene type | protein-coding |
| Map location | 4p15.31 |
| Pascal p-value | 0.023 |
| Sherlock p-value | 0.007 |
| Fetal beta | 0.554 |
| eGene | Myers' cis & trans |
Gene in Data Sources
| Gene set name | Method of gene set | Description | Info |
|---|---|---|---|
| CV:PGCnp | Genome-wide Association Study | GWAS |
Section I. Genetics and epigenetics annotation
 eQTL annotation
| SNP ID | Chromosome | Position | eGene | Gene Entrez ID | pvalue | qvalue | TSS distance | eQTL type |
|---|---|---|---|---|---|---|---|---|
| rs6032295 | chr20 | 44178138 | DCAF16 | 54876 | 0.14 | trans |
Section II. Transcriptome annotation
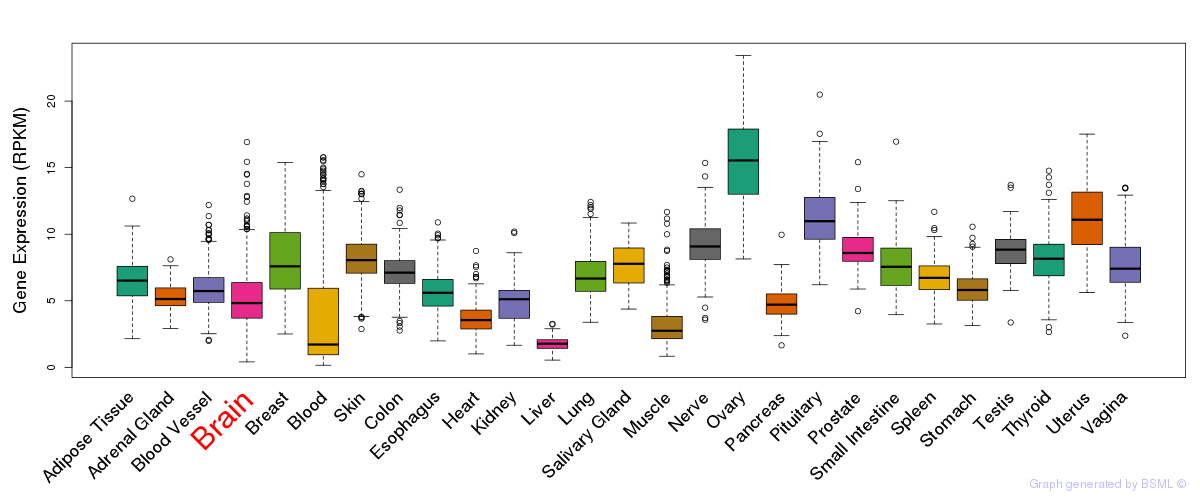
General gene expression (GTEx)
Gene expression during devlopment (BrainCloud)
Footnote:
A total of 269 time points ploted, with n=38 fetal samples (x=1:38). Each triangle represents one time point.
Gene expression of temporal and spatial changes (BrainSpan)
Footnote:
SC: sub-cortical regions; SM: sensory-motor regions; FC: frontal cortex; and TP: temporal-parietal cortex
ST1: fetal (13 - 26 postconception weeks), ST2: early infancy to late childhood (4 months to 11 years), and ST3: adolescence to adulthood (13 - 23 years)
The bar shown representes the lower 25% and upper 25% of the expression distribution.
Top co-expressed genes in brain regions
| Top 10 positively co-expressed genes | ||
| Gene | Pearson's Correlation | Spearman's Correlation |
| ZFAND2B | 0.81 | 0.77 |
| NIT1 | 0.81 | 0.77 |
| FUZ | 0.80 | 0.76 |
| GRHPR | 0.80 | 0.77 |
| ZNF511 | 0.78 | 0.76 |
| MLST8 | 0.78 | 0.75 |
| CYHR1 | 0.78 | 0.74 |
| AES | 0.77 | 0.75 |
| PEX10 | 0.77 | 0.74 |
| THAP7 | 0.77 | 0.73 |
| Top 10 negatively co-expressed genes | ||
| Gene | Pearson's Correlation | Spearman's Correlation |
| AF347015.18 | -0.47 | -0.35 |
| MT-ATP8 | -0.44 | -0.34 |
| AC010300.1 | -0.42 | -0.42 |
| AF347015.8 | -0.40 | -0.28 |
| AF347015.21 | -0.40 | -0.31 |
| SEC62 | -0.39 | -0.38 |
| AF347015.26 | -0.38 | -0.26 |
| AL139819.3 | -0.37 | -0.35 |
| AF347015.15 | -0.36 | -0.27 |
| MT-CYB | -0.36 | -0.27 |
Section V. Pathway annotation
| Pathway name | Pathway size | # SZGR 2.0 genes in pathway | Info |
|---|---|---|---|
| BASAKI YBX1 TARGETS DN | 384 | 230 | All SZGR 2.0 genes in this pathway |
| WANG LMO4 TARGETS UP | 372 | 227 | All SZGR 2.0 genes in this pathway |
| LASTOWSKA NEUROBLASTOMA COPY NUMBER DN | 800 | 473 | All SZGR 2.0 genes in this pathway |
| BENPORATH CYCLING GENES | 648 | 385 | All SZGR 2.0 genes in this pathway |
| WHITFIELD CELL CYCLE S | 162 | 86 | All SZGR 2.0 genes in this pathway |
| MARTENS TRETINOIN RESPONSE DN | 841 | 431 | All SZGR 2.0 genes in this pathway |
| JOHNSTONE PARVB TARGETS 1 DN | 63 | 39 | All SZGR 2.0 genes in this pathway |
| ZWANG TRANSIENTLY UP BY 1ST EGF PULSE ONLY | 1839 | 928 | All SZGR 2.0 genes in this pathway |
Section VI. microRNA annotation
| miRNA family | Target position | miRNA ID | miRNA seq | ||
|---|---|---|---|---|---|
| UTR start | UTR end | Match method | |||
| miR-124/506 | 2740 | 2746 | m8 | hsa-miR-506 | UAAGGCACCCUUCUGAGUAGA |
| hsa-miR-124brain | UAAGGCACGCGGUGAAUGCC | ||||
| miR-452 | 1342 | 1348 | m8 | hsa-miR-452 | UGUUUGCAGAGGAAACUGAGAC |
- SZ: miRNAs which differentially expressed in brain cortex of schizophrenia patients comparing with control samples using microarray. Click here to see the list of SZ related miRNAs.
- Brain: miRNAs which are expressed in brain based on miRNA microarray expression studies. Click here to see the list of brain related miRNAs.