Gene Page: OCIAD1
Summary ?
| GeneID | 54940 |
| Symbol | OCIAD1 |
| Synonyms | ASRIJ|OCIA|TPA018 |
| Description | OCIA domain containing 1 |
| Reference | HGNC:HGNC:16074|Ensembl:ENSG00000109180|HPRD:17654|Vega:OTTHUMG00000102095 |
| Gene type | protein-coding |
| Map location | 4p11 |
| Pascal p-value | 0.029 |
| Sherlock p-value | 0.218 |
| Fetal beta | -0.499 |
| DMG | 1 (# studies) |
| eGene | Myers' cis & trans |
Gene in Data Sources
| Gene set name | Method of gene set | Description | Info |
|---|---|---|---|
| CV:PGCnp | Genome-wide Association Study | GWAS | |
| DMG:Jaffe_2016 | Genome-wide DNA methylation analysis | This dataset includes 2,104 probes/CpGs associated with SZ patients (n=108) compared to 136 controls at Bonferroni-adjusted P < 0.05. | 1 |
Section I. Genetics and epigenetics annotation
 Differentially methylated gene
| Probe | Chromosome | Position | Nearest gene | P (dis) | Beta (dis) | FDR (dis) | Study |
|---|---|---|---|---|---|---|---|
| cg14315992 | 4 | 48833004 | OCIAD1 | 2.34E-8 | -0.01 | 7.73E-6 | DMG:Jaffe_2016 |
eQTL annotation
| SNP ID | Chromosome | Position | eGene | Gene Entrez ID | pvalue | qvalue | TSS distance | eQTL type |
|---|---|---|---|---|---|---|---|---|
| rs16894557 | chr6 | 28999825 | OCIAD1 | 54940 | 0.07 | trans |
Section II. Transcriptome annotation
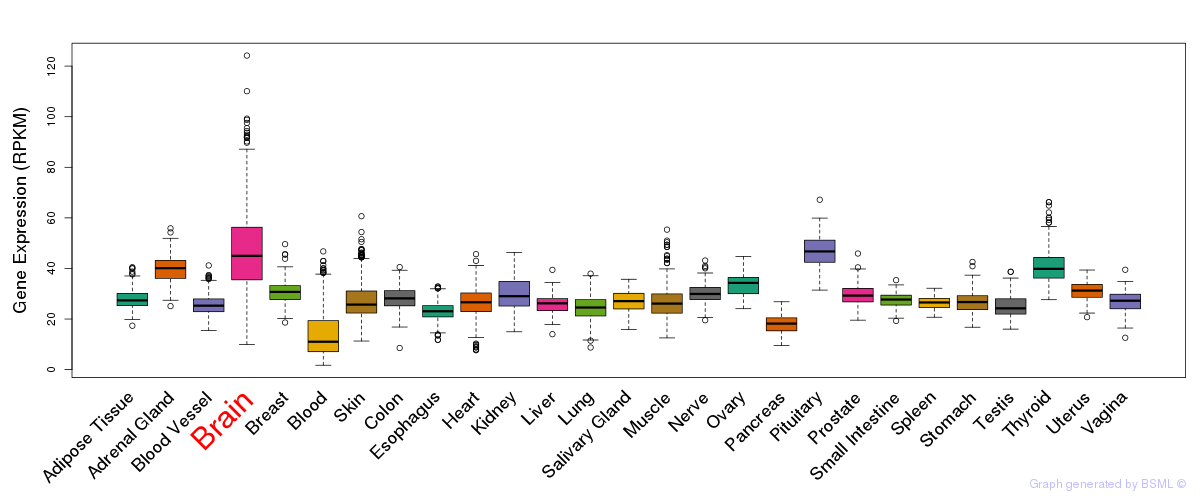
General gene expression (GTEx)
Gene expression during devlopment (BrainCloud)
Footnote:
A total of 269 time points ploted, with n=38 fetal samples (x=1:38). Each triangle represents one time point.
Gene expression of temporal and spatial changes (BrainSpan)
Footnote:
SC: sub-cortical regions; SM: sensory-motor regions; FC: frontal cortex; and TP: temporal-parietal cortex
ST1: fetal (13 - 26 postconception weeks), ST2: early infancy to late childhood (4 months to 11 years), and ST3: adolescence to adulthood (13 - 23 years)
The bar shown representes the lower 25% and upper 25% of the expression distribution.
Top co-expressed genes in brain regions
| Top 10 positively co-expressed genes | ||
| Gene | Pearson's Correlation | Spearman's Correlation |
| RSL1D1 | 0.88 | 0.89 |
| ZNF277 | 0.88 | 0.87 |
| AC114744.1 | 0.88 | 0.89 |
| RBM34 | 0.88 | 0.88 |
| PMS1 | 0.87 | 0.88 |
| AC068888.1 | 0.86 | 0.85 |
| CBX3 | 0.86 | 0.89 |
| SDCCAG10 | 0.86 | 0.84 |
| DNTTIP2 | 0.85 | 0.89 |
| ZUFSP | 0.85 | 0.87 |
| Top 10 negatively co-expressed genes | ||
| Gene | Pearson's Correlation | Spearman's Correlation |
| HLA-F | -0.64 | -0.76 |
| AIFM3 | -0.62 | -0.73 |
| GPER | -0.61 | -0.73 |
| HLA-C | -0.61 | -0.70 |
| MT-CO2 | -0.61 | -0.74 |
| AF347015.2 | -0.61 | -0.77 |
| MT-CYB | -0.61 | -0.74 |
| TINAGL1 | -0.60 | -0.73 |
| HLA-E | -0.60 | -0.70 |
| AF347015.33 | -0.60 | -0.74 |
Section V. Pathway annotation
| Pathway name | Pathway size | # SZGR 2.0 genes in pathway | Info |
|---|---|---|---|
| FULCHER INFLAMMATORY RESPONSE LECTIN VS LPS DN | 463 | 290 | All SZGR 2.0 genes in this pathway |
| WANG LMO4 TARGETS UP | 372 | 227 | All SZGR 2.0 genes in this pathway |
| WANG LMO4 TARGETS DN | 352 | 225 | All SZGR 2.0 genes in this pathway |
| VECCHI GASTRIC CANCER ADVANCED VS EARLY UP | 175 | 120 | All SZGR 2.0 genes in this pathway |
| NUYTTEN NIPP1 TARGETS DN | 848 | 527 | All SZGR 2.0 genes in this pathway |
| LIU COMMON CANCER GENES | 79 | 47 | All SZGR 2.0 genes in this pathway |
| BENPORATH MYC MAX TARGETS | 775 | 494 | All SZGR 2.0 genes in this pathway |
| CHESLER BRAIN QTL CIS | 75 | 51 | All SZGR 2.0 genes in this pathway |
| HEDENFALK BREAST CANCER BRACX DN | 20 | 14 | All SZGR 2.0 genes in this pathway |
| ACEVEDO LIVER TUMOR VS NORMAL ADJACENT TISSUE DN | 274 | 165 | All SZGR 2.0 genes in this pathway |
| LEE DIFFERENTIATING T LYMPHOCYTE | 200 | 115 | All SZGR 2.0 genes in this pathway |
| DANG BOUND BY MYC | 1103 | 714 | All SZGR 2.0 genes in this pathway |
| LU EZH2 TARGETS DN | 414 | 237 | All SZGR 2.0 genes in this pathway |