Gene Page: C1orf159
Summary ?
| GeneID | 54991 |
| Symbol | C1orf159 |
| Synonyms | - |
| Description | chromosome 1 open reading frame 159 |
| Reference | HGNC:HGNC:26062|Ensembl:ENSG00000131591|HPRD:07930|Vega:OTTHUMG00000000745 |
| Gene type | protein-coding |
| Map location | 1p36.33 |
| Pascal p-value | 0.367 |
| Fetal beta | -0.28 |
| DMG | 1 (# studies) |
| eGene | Caudate basal ganglia Cortex Frontal Cortex BA9 Hippocampus Nucleus accumbens basal ganglia Putamen basal ganglia Meta |
Gene in Data Sources
| Gene set name | Method of gene set | Description | Info |
|---|---|---|---|
| CV:PGCnp | Genome-wide Association Study | GWAS | |
| DMG:Wockner_2014 | Genome-wide DNA methylation analysis | This dataset includes 4641 differentially methylated probes corresponding to 2929 unique genes between schizophrenia patients (n=24) and controls (n=24). | 1 |
Section I. Genetics and epigenetics annotation
 Differentially methylated gene
| Probe | Chromosome | Position | Nearest gene | P (dis) | Beta (dis) | FDR (dis) | Study |
|---|---|---|---|---|---|---|---|
| cg05527091 | 1 | 1046324 | C1orf159 | 2.597E-4 | 0.412 | 0.038 | DMG:Wockner_2014 |
eQTL annotation
| SNP ID | Chromosome | Position | eGene | Gene Entrez ID | pvalue | qvalue | TSS distance | eQTL type |
|---|---|---|---|---|---|---|---|---|
| rs74048006 | 1 | 1027845 | C1orf159 | ENSG00000131591.13 | 1.904E-8 | 0 | 23896 | gtex_brain_putamen_basal |
| rs76994018 | 1 | 1027846 | C1orf159 | ENSG00000131591.13 | 1.9E-8 | 0 | 23895 | gtex_brain_putamen_basal |
| rs6689308 | 1 | 1029805 | C1orf159 | ENSG00000131591.13 | 1.173E-8 | 0 | 21936 | gtex_brain_putamen_basal |
| rs6687776 | 1 | 1030565 | C1orf159 | ENSG00000131591.13 | 2.12E-8 | 0 | 21176 | gtex_brain_putamen_basal |
| rs6678318 | 1 | 1030633 | C1orf159 | ENSG00000131591.13 | 2.12E-8 | 0 | 21108 | gtex_brain_putamen_basal |
| rs9651270 | 1 | 1031973 | C1orf159 | ENSG00000131591.13 | 1.789E-8 | 0 | 19768 | gtex_brain_putamen_basal |
| rs6699750 | 1 | 1032954 | C1orf159 | ENSG00000131591.13 | 1.654E-8 | 0 | 18787 | gtex_brain_putamen_basal |
| rs6604964 | 1 | 1033596 | C1orf159 | ENSG00000131591.13 | 1.246E-8 | 0 | 18145 | gtex_brain_putamen_basal |
| rs6604965 | 1 | 1033626 | C1orf159 | ENSG00000131591.13 | 9.561E-8 | 0 | 18115 | gtex_brain_putamen_basal |
| rs6604966 | 1 | 1033670 | C1orf159 | ENSG00000131591.13 | 1.15E-8 | 0 | 18071 | gtex_brain_putamen_basal |
| rs6604967 | 1 | 1033680 | C1orf159 | ENSG00000131591.13 | 1.673E-8 | 0 | 18061 | gtex_brain_putamen_basal |
| rs6698368 | 1 | 1033994 | C1orf159 | ENSG00000131591.13 | 1.504E-8 | 0 | 17747 | gtex_brain_putamen_basal |
| rs77977351 | 1 | 1034200 | C1orf159 | ENSG00000131591.13 | 1.495E-8 | 0 | 17541 | gtex_brain_putamen_basal |
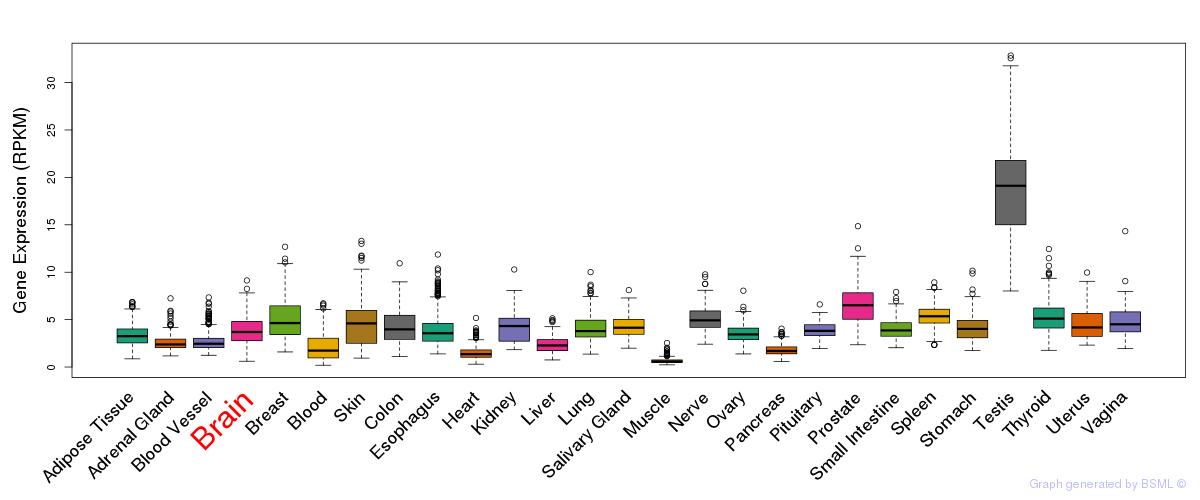
Section II. Transcriptome annotation
General gene expression (GTEx)
Gene expression during devlopment (BrainCloud)
Footnote:
A total of 269 time points ploted, with n=38 fetal samples (x=1:38). Each triangle represents one time point.
Gene expression of temporal and spatial changes (BrainSpan)
Footnote:
SC: sub-cortical regions; SM: sensory-motor regions; FC: frontal cortex; and TP: temporal-parietal cortex
ST1: fetal (13 - 26 postconception weeks), ST2: early infancy to late childhood (4 months to 11 years), and ST3: adolescence to adulthood (13 - 23 years)
The bar shown representes the lower 25% and upper 25% of the expression distribution.
Top co-expressed genes in brain regions
| Top 10 positively co-expressed genes | ||
| Gene | Pearson's Correlation | Spearman's Correlation |
| KLK6 | 0.97 | 0.94 |
| CNP | 0.96 | 0.90 |
| C11orf9 | 0.96 | 0.92 |
| LDB3 | 0.95 | 0.93 |
| TF | 0.95 | 0.96 |
| ATPGD1 | 0.95 | 0.95 |
| CLDN11 | 0.95 | 0.90 |
| GALNT6 | 0.95 | 0.88 |
| LDLRAP1 | 0.94 | 0.87 |
| TTYH2 | 0.94 | 0.86 |
| Top 10 negatively co-expressed genes | ||
| Gene | Pearson's Correlation | Spearman's Correlation |
| NKIRAS2 | -0.54 | -0.69 |
| TRNAU1AP | -0.53 | -0.73 |
| TUBB2B | -0.52 | -0.78 |
| NR2C2AP | -0.52 | -0.76 |
| HN1 | -0.52 | -0.72 |
| POLB | -0.52 | -0.76 |
| ALKBH2 | -0.52 | -0.75 |
| KIAA1949 | -0.52 | -0.72 |
| RPL12 | -0.52 | -0.76 |
| IFT52 | -0.52 | -0.73 |
Section V. Pathway annotation
| Pathway name | Pathway size | # SZGR 2.0 genes in pathway | Info |
|---|---|---|---|
| HUTTMANN B CLL POOR SURVIVAL UP | 276 | 187 | All SZGR 2.0 genes in this pathway |
| GRAESSMANN APOPTOSIS BY DOXORUBICIN DN | 1781 | 1082 | All SZGR 2.0 genes in this pathway |
| JOHANSSON GLIOMAGENESIS BY PDGFB UP | 58 | 44 | All SZGR 2.0 genes in this pathway |
| AIYAR COBRA1 TARGETS UP | 39 | 25 | All SZGR 2.0 genes in this pathway |
| JIANG VHL TARGETS | 138 | 91 | All SZGR 2.0 genes in this pathway |
| MARSON BOUND BY E2F4 UNSTIMULATED | 728 | 415 | All SZGR 2.0 genes in this pathway |
| BHAT ESR1 TARGETS VIA AKT1 UP | 281 | 183 | All SZGR 2.0 genes in this pathway |
| GOBERT OLIGODENDROCYTE DIFFERENTIATION UP | 570 | 339 | All SZGR 2.0 genes in this pathway |