Gene Page: TRIM62
Summary ?
| GeneID | 55223 |
| Symbol | TRIM62 |
| Synonyms | DEAR1 |
| Description | tripartite motif containing 62 |
| Reference | MIM:616755|HGNC:HGNC:25574|Ensembl:ENSG00000116525|HPRD:07697|Vega:OTTHUMG00000004132 |
| Gene type | protein-coding |
| Map location | 1p35.1 |
| Pascal p-value | 0.308 |
| Fetal beta | -0.002 |
| DMG | 1 (# studies) |
Gene in Data Sources
| Gene set name | Method of gene set | Description | Info |
|---|---|---|---|
| CV:PGCnp | Genome-wide Association Study | GWAS | |
| DMG:Wockner_2014 | Genome-wide DNA methylation analysis | This dataset includes 4641 differentially methylated probes corresponding to 2929 unique genes between schizophrenia patients (n=24) and controls (n=24). | 1 |
Section I. Genetics and epigenetics annotation
 Differentially methylated gene
| Probe | Chromosome | Position | Nearest gene | P (dis) | Beta (dis) | FDR (dis) | Study |
|---|---|---|---|---|---|---|---|
| cg17109517 | 1 | 33646373 | TRIM62 | 1.622E-4 | -0.469 | 0.032 | DMG:Wockner_2014 |
Section II. Transcriptome annotation
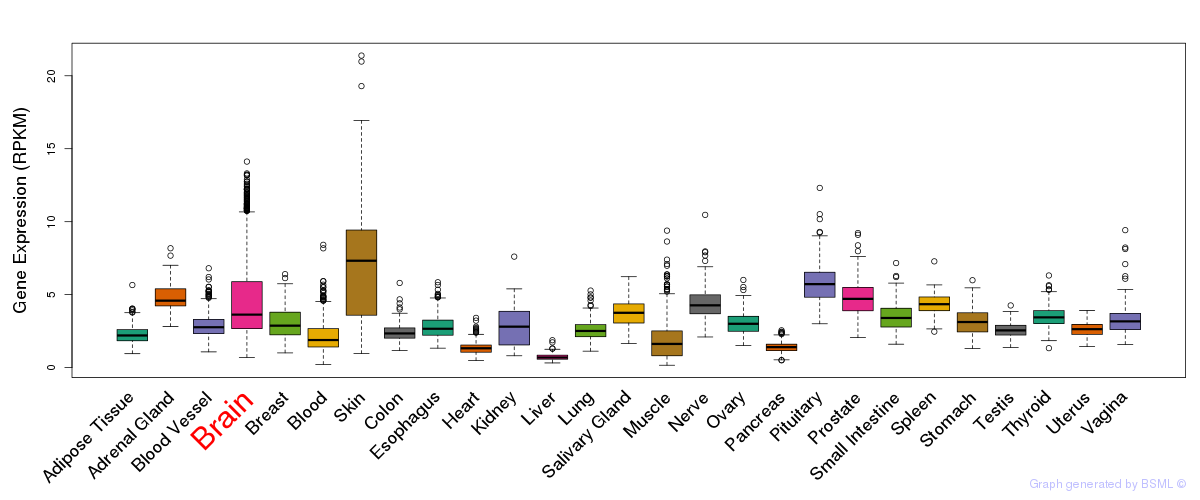
General gene expression (GTEx)
Gene expression during devlopment (BrainCloud)
Footnote:
A total of 269 time points ploted, with n=38 fetal samples (x=1:38). Each triangle represents one time point.
Gene expression of temporal and spatial changes (BrainSpan)
Footnote:
SC: sub-cortical regions; SM: sensory-motor regions; FC: frontal cortex; and TP: temporal-parietal cortex
ST1: fetal (13 - 26 postconception weeks), ST2: early infancy to late childhood (4 months to 11 years), and ST3: adolescence to adulthood (13 - 23 years)
The bar shown representes the lower 25% and upper 25% of the expression distribution.
Top co-expressed genes in brain regions
| Top 10 positively co-expressed genes | ||
| Gene | Pearson's Correlation | Spearman's Correlation |
| LRRC48 | 0.93 | 0.66 |
| C3orf25 | 0.93 | 0.63 |
| C6orf118 | 0.93 | 0.53 |
| CCDC81 | 0.93 | 0.48 |
| C19orf51 | 0.92 | 0.55 |
| ARMC4 | 0.92 | 0.57 |
| CCDC108 | 0.92 | 0.65 |
| C16orf71 | 0.92 | 0.62 |
| RP11-282K6.1 | 0.92 | 0.50 |
| DNAH9 | 0.92 | 0.61 |
| Top 10 negatively co-expressed genes | ||
| Gene | Pearson's Correlation | Spearman's Correlation |
| MT-CO2 | -0.25 | -0.34 |
| AF347015.31 | -0.25 | -0.35 |
| AF347015.2 | -0.24 | -0.34 |
| AF347015.21 | -0.24 | -0.38 |
| AF347015.27 | -0.24 | -0.32 |
| AF347015.8 | -0.24 | -0.31 |
| MT-CYB | -0.23 | -0.31 |
| AF347015.33 | -0.23 | -0.29 |
| AF347015.15 | -0.22 | -0.28 |
| MT-ATP8 | -0.21 | -0.33 |
Section V. Pathway annotation
| Pathway name | Pathway size | # SZGR 2.0 genes in pathway | Info |
|---|---|---|---|
| LEE NEURAL CREST STEM CELL UP | 146 | 99 | All SZGR 2.0 genes in this pathway |
| LASTOWSKA NEUROBLASTOMA COPY NUMBER DN | 800 | 473 | All SZGR 2.0 genes in this pathway |
| CREIGHTON ENDOCRINE THERAPY RESISTANCE 5 | 482 | 296 | All SZGR 2.0 genes in this pathway |
| LEIN CEREBELLUM MARKERS | 85 | 47 | All SZGR 2.0 genes in this pathway |
| MASSARWEH TAMOXIFEN RESISTANCE UP | 578 | 341 | All SZGR 2.0 genes in this pathway |
| ZHENG GLIOBLASTOMA PLASTICITY UP | 250 | 168 | All SZGR 2.0 genes in this pathway |
| MIYAGAWA TARGETS OF EWSR1 ETS FUSIONS UP | 259 | 159 | All SZGR 2.0 genes in this pathway |
| PHONG TNF RESPONSE NOT VIA P38 | 337 | 236 | All SZGR 2.0 genes in this pathway |