Gene Page: H2AFY2
Summary ?
| GeneID | 55506 |
| Symbol | H2AFY2 |
| Synonyms | macroH2A2 |
| Description | H2A histone family member Y2 |
| Reference | MIM:616141|HGNC:HGNC:14453|Ensembl:ENSG00000099284|HPRD:13625|Vega:OTTHUMG00000018396 |
| Gene type | protein-coding |
| Map location | 10q22.1 |
| Pascal p-value | 0.502 |
| Sherlock p-value | 0.731 |
| Fetal beta | 2.624 |
| DMG | 1 (# studies) |
Gene in Data Sources
| Gene set name | Method of gene set | Description | Info |
|---|---|---|---|
| CV:PGCnp | Genome-wide Association Study | GWAS | |
| DMG:Jaffe_2016 | Genome-wide DNA methylation analysis | This dataset includes 2,104 probes/CpGs associated with SZ patients (n=108) compared to 136 controls at Bonferroni-adjusted P < 0.05. | 1 |
Section I. Genetics and epigenetics annotation
 Differentially methylated gene
| Probe | Chromosome | Position | Nearest gene | P (dis) | Beta (dis) | FDR (dis) | Study |
|---|---|---|---|---|---|---|---|
| cg14617642 | 10 | 71812630 | H2AFY2 | 3.32E-10 | -0.016 | 7.18E-7 | DMG:Jaffe_2016 |
Section II. Transcriptome annotation
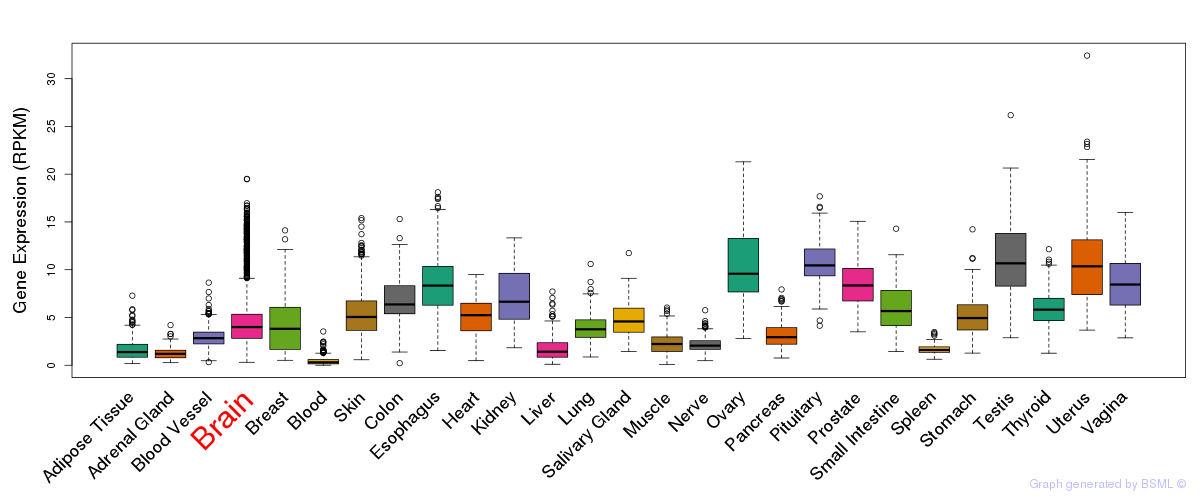
General gene expression (GTEx)
Gene expression during devlopment (BrainCloud)
Footnote:
A total of 269 time points ploted, with n=38 fetal samples (x=1:38). Each triangle represents one time point.
Gene expression of temporal and spatial changes (BrainSpan)
Footnote:
SC: sub-cortical regions; SM: sensory-motor regions; FC: frontal cortex; and TP: temporal-parietal cortex
ST1: fetal (13 - 26 postconception weeks), ST2: early infancy to late childhood (4 months to 11 years), and ST3: adolescence to adulthood (13 - 23 years)
The bar shown representes the lower 25% and upper 25% of the expression distribution.
Top co-expressed genes in brain regions
| Top 10 positively co-expressed genes | ||
| Gene | Pearson's Correlation | Spearman's Correlation |
| EBP | 0.88 | 0.92 |
| STK19 | 0.88 | 0.92 |
| TRAPPC4 | 0.88 | 0.92 |
| ACTL6B | 0.87 | 0.92 |
| TRNAU1AP | 0.87 | 0.90 |
| NOP56 | 0.87 | 0.89 |
| DUSP12 | 0.87 | 0.90 |
| STMN4 | 0.86 | 0.88 |
| CARS2 | 0.86 | 0.88 |
| NAGK | 0.86 | 0.87 |
| Top 10 negatively co-expressed genes | ||
| Gene | Pearson's Correlation | Spearman's Correlation |
| AF347015.27 | -0.76 | -0.84 |
| AF347015.33 | -0.75 | -0.84 |
| MT-CO2 | -0.74 | -0.82 |
| AF347015.8 | -0.74 | -0.84 |
| MT-CYB | -0.74 | -0.84 |
| AF347015.31 | -0.73 | -0.80 |
| AF347015.15 | -0.73 | -0.83 |
| AF347015.2 | -0.72 | -0.85 |
| AF347015.26 | -0.71 | -0.85 |
| HLA-F | -0.70 | -0.74 |
Section V. Pathway annotation
| Pathway name | Pathway size | # SZGR 2.0 genes in pathway | Info |
|---|---|---|---|
| KEGG SYSTEMIC LUPUS ERYTHEMATOSUS | 140 | 100 | All SZGR 2.0 genes in this pathway |
| ODONNELL TFRC TARGETS UP | 456 | 228 | All SZGR 2.0 genes in this pathway |
| ZHOU INFLAMMATORY RESPONSE FIMA UP | 544 | 308 | All SZGR 2.0 genes in this pathway |
| KINSEY TARGETS OF EWSR1 FLII FUSION UP | 1278 | 748 | All SZGR 2.0 genes in this pathway |
| PROVENZANI METASTASIS UP | 194 | 112 | All SZGR 2.0 genes in this pathway |
| GAUSSMANN MLL AF4 FUSION TARGETS C UP | 170 | 114 | All SZGR 2.0 genes in this pathway |
| LASTOWSKA NEUROBLASTOMA COPY NUMBER DN | 800 | 473 | All SZGR 2.0 genes in this pathway |
| EBAUER TARGETS OF PAX3 FOXO1 FUSION DN | 48 | 31 | All SZGR 2.0 genes in this pathway |
| ACEVEDO LIVER CANCER WITH H3K27ME3 UP | 295 | 149 | All SZGR 2.0 genes in this pathway |
| SMID BREAST CANCER BASAL UP | 648 | 398 | All SZGR 2.0 genes in this pathway |
| EHLERS ANEUPLOIDY UP | 41 | 29 | All SZGR 2.0 genes in this pathway |
| YOSHIOKA LIVER CANCER EARLY RECURRENCE UP | 40 | 23 | All SZGR 2.0 genes in this pathway |
| KIM TIAL1 TARGETS | 32 | 22 | All SZGR 2.0 genes in this pathway |