Gene Page: LRRC16A
Summary ?
| GeneID | 55604 |
| Symbol | LRRC16A |
| Synonyms | CARMIL|CARMIL1|CARMIL1a|LRRC16|dJ501N12.1|dJ501N12.5 |
| Description | leucine rich repeat containing 16A |
| Reference | MIM:609593|HGNC:HGNC:21581|Ensembl:ENSG00000079691|HPRD:11285|Vega:OTTHUMG00000014393 |
| Gene type | protein-coding |
| Map location | 6p22.2 |
| Pascal p-value | 3.664E-4 |
| Fetal beta | 1.08 |
| DMG | 1 (# studies) |
| eGene | Myers' cis & trans |
Gene in Data Sources
| Gene set name | Method of gene set | Description | Info |
|---|---|---|---|
| CV:GWASdb | Genome-wide Association Studies | GWASdb records for schizophrenia | |
| CV:PGCnp | Genome-wide Association Study | GWAS | |
| DMG:Jaffe_2016 | Genome-wide DNA methylation analysis | This dataset includes 2,104 probes/CpGs associated with SZ patients (n=108) compared to 136 controls at Bonferroni-adjusted P < 0.05. | 1 |
Section I. Genetics and epigenetics annotation
 Differentially methylated gene
| Probe | Chromosome | Position | Nearest gene | P (dis) | Beta (dis) | FDR (dis) | Study |
|---|---|---|---|---|---|---|---|
| cg20955831 | 6 | 25279788 | LRRC16A | 4.1E-8 | -0.01 | 1.15E-5 | DMG:Jaffe_2016 |
eQTL annotation
| SNP ID | Chromosome | Position | eGene | Gene Entrez ID | pvalue | qvalue | TSS distance | eQTL type |
|---|---|---|---|---|---|---|---|---|
| rs7551082 | chr1 | 119540841 | LRRC16A | 55604 | 0.03 | trans | ||
| rs2498500 | chr1 | 119673092 | LRRC16A | 55604 | 0 | trans |
Section II. Transcriptome annotation
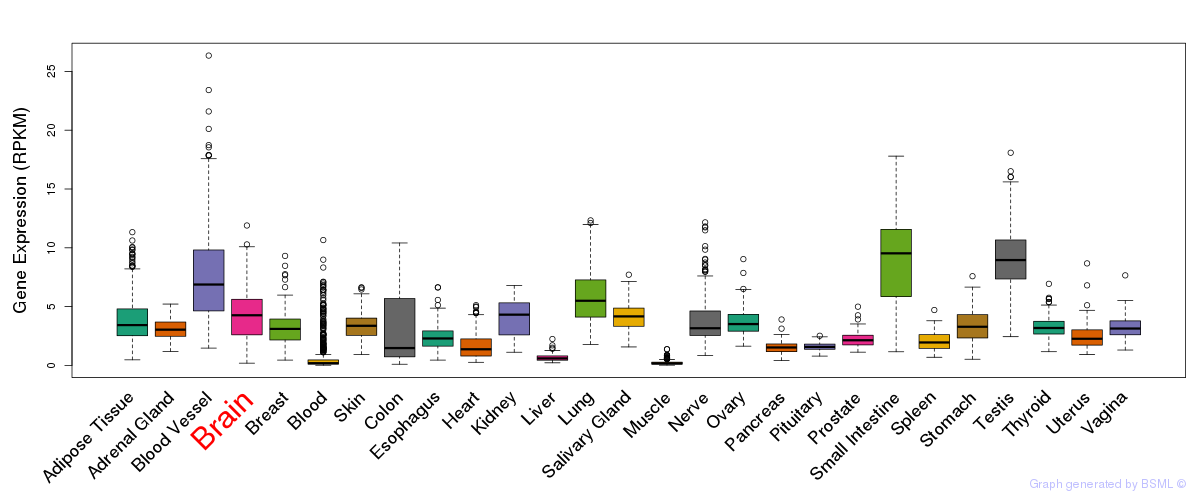
General gene expression (GTEx)
Gene expression during devlopment (BrainCloud)
Footnote:
A total of 269 time points ploted, with n=38 fetal samples (x=1:38). Each triangle represents one time point.
Gene expression of temporal and spatial changes (BrainSpan)
Footnote:
SC: sub-cortical regions; SM: sensory-motor regions; FC: frontal cortex; and TP: temporal-parietal cortex
ST1: fetal (13 - 26 postconception weeks), ST2: early infancy to late childhood (4 months to 11 years), and ST3: adolescence to adulthood (13 - 23 years)
The bar shown representes the lower 25% and upper 25% of the expression distribution.
Top co-expressed genes in brain regions
| Top 10 positively co-expressed genes | ||
| Gene | Pearson's Correlation | Spearman's Correlation |
| KIF23 | 0.97 | 0.68 |
| MELK | 0.97 | 0.74 |
| CCNA2 | 0.97 | 0.74 |
| BUB1 | 0.96 | 0.71 |
| PBK | 0.96 | 0.68 |
| CCNB2 | 0.96 | 0.71 |
| KIF11 | 0.96 | 0.70 |
| DEPDC1 | 0.96 | 0.60 |
| EXO1 | 0.96 | 0.62 |
| KIF4A | 0.96 | 0.72 |
| Top 10 negatively co-expressed genes | ||
| Gene | Pearson's Correlation | Spearman's Correlation |
| ASPHD1 | -0.37 | -0.50 |
| HLA-F | -0.37 | -0.54 |
| CA4 | -0.36 | -0.61 |
| C5orf53 | -0.36 | -0.53 |
| FBXO2 | -0.36 | -0.50 |
| SLC9A3R2 | -0.36 | -0.37 |
| TNFSF12 | -0.35 | -0.47 |
| CCNI2 | -0.35 | -0.50 |
| AF347015.27 | -0.35 | -0.57 |
| PTH1R | -0.35 | -0.47 |
Section III. Gene Ontology annotation
| Molecular function | GO term | Evidence | Neuro keywords | PubMed ID |
|---|---|---|---|---|
| GO:0005515 | protein binding | IEA | - | |
| Cellular component | GO term | Evidence | Neuro keywords | PubMed ID |
| GO:0005737 | cytoplasm | IEA | - |
Section V. Pathway annotation
| Pathway name | Pathway size | # SZGR 2.0 genes in pathway | Info |
|---|---|---|---|
| CASORELLI ACUTE PROMYELOCYTIC LEUKEMIA DN | 663 | 425 | All SZGR 2.0 genes in this pathway |
| COLDREN GEFITINIB RESISTANCE DN | 230 | 115 | All SZGR 2.0 genes in this pathway |
| GRAESSMANN APOPTOSIS BY DOXORUBICIN DN | 1781 | 1082 | All SZGR 2.0 genes in this pathway |
| XU HGF TARGETS INDUCED BY AKT1 48HR DN | 27 | 17 | All SZGR 2.0 genes in this pathway |
| LIAO METASTASIS | 539 | 324 | All SZGR 2.0 genes in this pathway |
| BOYLAN MULTIPLE MYELOMA C UP | 47 | 29 | All SZGR 2.0 genes in this pathway |
| VANASSE BCL2 TARGETS DN | 74 | 50 | All SZGR 2.0 genes in this pathway |
| VERHAAK GLIOBLASTOMA CLASSICAL | 162 | 122 | All SZGR 2.0 genes in this pathway |
| ZWANG TRANSIENTLY UP BY 1ST EGF PULSE ONLY | 1839 | 928 | All SZGR 2.0 genes in this pathway |
Section VI. microRNA annotation
| miRNA family | Target position | miRNA ID | miRNA seq | ||
|---|---|---|---|---|---|
| UTR start | UTR end | Match method | |||
| miR-145 | 374 | 380 | m8 | hsa-miR-145 | GUCCAGUUUUCCCAGGAAUCCCUU |
| miR-153 | 482 | 488 | 1A | hsa-miR-153 | UUGCAUAGUCACAAAAGUGA |
| miR-19 | 489 | 495 | 1A | hsa-miR-19a | UGUGCAAAUCUAUGCAAAACUGA |
| hsa-miR-19b | UGUGCAAAUCCAUGCAAAACUGA | ||||
| miR-22 | 325 | 332 | 1A,m8 | hsa-miR-22brain | AAGCUGCCAGUUGAAGAACUGU |
| miR-26 | 308 | 315 | 1A,m8 | hsa-miR-26abrain | UUCAAGUAAUCCAGGAUAGGC |
| hsa-miR-26bSZ | UUCAAGUAAUUCAGGAUAGGUU | ||||
| miR-381 | 528 | 534 | 1A | hsa-miR-381 | UAUACAAGGGCAAGCUCUCUGU |
| miR-448 | 482 | 488 | 1A | hsa-miR-448 | UUGCAUAUGUAGGAUGUCCCAU |
- SZ: miRNAs which differentially expressed in brain cortex of schizophrenia patients comparing with control samples using microarray. Click here to see the list of SZ related miRNAs.
- Brain: miRNAs which are expressed in brain based on miRNA microarray expression studies. Click here to see the list of brain related miRNAs.