Gene Page: BTBD7
Summary ?
| GeneID | 55727 |
| Symbol | BTBD7 |
| Synonyms | FUP1 |
| Description | BTB domain containing 7 |
| Reference | MIM:610386|HGNC:HGNC:18269|Ensembl:ENSG00000011114|HPRD:12541|Vega:OTTHUMG00000171269 |
| Gene type | protein-coding |
| Map location | 14q32.12 |
| Pascal p-value | 5.103E-4 |
| Fetal beta | 1.756 |
| DMG | 1 (# studies) |
Gene in Data Sources
| Gene set name | Method of gene set | Description | Info |
|---|---|---|---|
| CV:PGCnp | Genome-wide Association Study | GWAS | |
| DMG:vanEijk_2014 | Genome-wide DNA methylation analysis | This dataset includes 432 differentially methylated CpG sites corresponding to 391 unique transcripts between schizophrenia patients (n=260) and unaffected controls (n=250). | 1 |
Section I. Genetics and epigenetics annotation
 Differentially methylated gene
| Probe | Chromosome | Position | Nearest gene | P (dis) | Beta (dis) | FDR (dis) | Study |
|---|---|---|---|---|---|---|---|
| cg16290737 | 14 | 93389246 | BTBD7 | 0.002 | 1.748 | DMG:vanEijk_2014 |
Section II. Transcriptome annotation
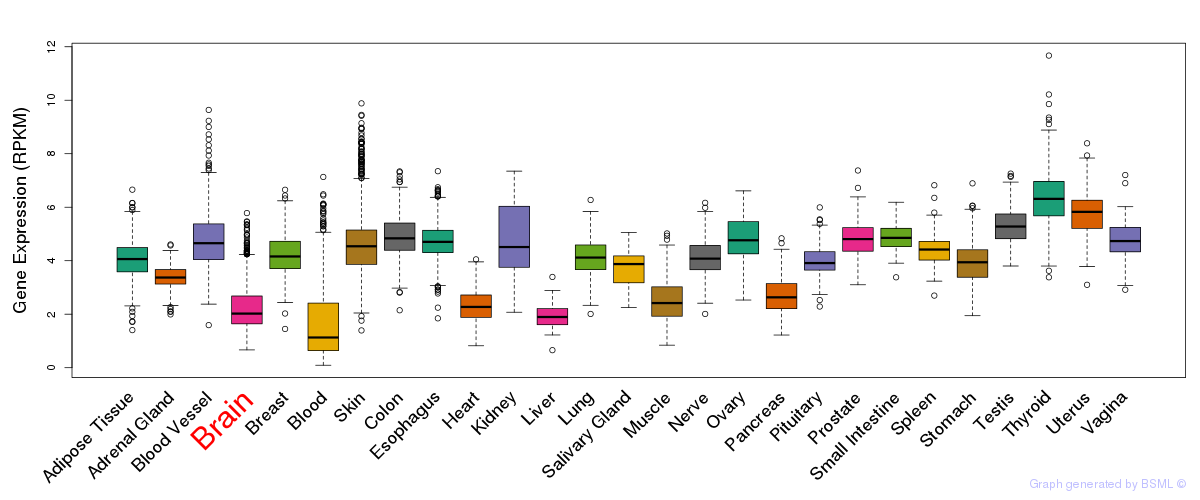
General gene expression (GTEx)
Gene expression during devlopment (BrainCloud)
Footnote:
A total of 269 time points ploted, with n=38 fetal samples (x=1:38). Each triangle represents one time point.
Gene expression of temporal and spatial changes (BrainSpan)
Footnote:
SC: sub-cortical regions; SM: sensory-motor regions; FC: frontal cortex; and TP: temporal-parietal cortex
ST1: fetal (13 - 26 postconception weeks), ST2: early infancy to late childhood (4 months to 11 years), and ST3: adolescence to adulthood (13 - 23 years)
The bar shown representes the lower 25% and upper 25% of the expression distribution.
Top co-expressed genes in brain regions
| Top 10 positively co-expressed genes | ||
| Gene | Pearson's Correlation | Spearman's Correlation |
| C3orf15 | 0.84 | 0.70 |
| WDR52 | 0.82 | 0.45 |
| DNAH6 | 0.82 | 0.67 |
| DNAH12 | 0.82 | 0.54 |
| SPAG17 | 0.81 | 0.42 |
| C10orf79 | 0.80 | 0.63 |
| CXorf30 | 0.79 | 0.26 |
| ZBBX | 0.78 | 0.49 |
| C12orf63 | 0.78 | 0.40 |
| C7orf63 | 0.78 | 0.49 |
| Top 10 negatively co-expressed genes | ||
| Gene | Pearson's Correlation | Spearman's Correlation |
| MT-CO2 | -0.37 | -0.49 |
| AF347015.31 | -0.37 | -0.49 |
| AF347015.2 | -0.37 | -0.47 |
| AF347015.8 | -0.36 | -0.47 |
| AF347015.21 | -0.36 | -0.45 |
| MT-CYB | -0.36 | -0.46 |
| AF347015.27 | -0.35 | -0.44 |
| HIGD1B | -0.34 | -0.47 |
| AF347015.15 | -0.34 | -0.43 |
| AF347015.33 | -0.33 | -0.41 |
Section V. Pathway annotation
| Pathway name | Pathway size | # SZGR 2.0 genes in pathway | Info |
|---|---|---|---|
| GARY CD5 TARGETS UP | 473 | 314 | All SZGR 2.0 genes in this pathway |
| DODD NASOPHARYNGEAL CARCINOMA UP | 1821 | 933 | All SZGR 2.0 genes in this pathway |
| GAUSSMANN MLL AF4 FUSION TARGETS A UP | 191 | 128 | All SZGR 2.0 genes in this pathway |
| HAMAI APOPTOSIS VIA TRAIL UP | 584 | 356 | All SZGR 2.0 genes in this pathway |
| NUYTTEN NIPP1 TARGETS UP | 769 | 437 | All SZGR 2.0 genes in this pathway |
| KRIGE RESPONSE TO TOSEDOSTAT 6HR DN | 911 | 527 | All SZGR 2.0 genes in this pathway |
| KRIGE RESPONSE TO TOSEDOSTAT 24HR DN | 1011 | 592 | All SZGR 2.0 genes in this pathway |
| ACEVEDO LIVER CANCER WITH H3K9ME3 DN | 120 | 71 | All SZGR 2.0 genes in this pathway |
| GABRIELY MIR21 TARGETS | 289 | 187 | All SZGR 2.0 genes in this pathway |
| PILON KLF1 TARGETS DN | 1972 | 1213 | All SZGR 2.0 genes in this pathway |
| KOINUMA TARGETS OF SMAD2 OR SMAD3 | 824 | 528 | All SZGR 2.0 genes in this pathway |