Gene Page: TRERF1
Summary ?
| GeneID | 55809 |
| Symbol | TRERF1 |
| Synonyms | BCAR2|HSA277276|RAPA|TREP132|TReP-132|dJ139D8.5 |
| Description | transcriptional regulating factor 1 |
| Reference | MIM:610322|HGNC:HGNC:18273|Ensembl:ENSG00000124496|HPRD:11647|Vega:OTTHUMG00000014698 |
| Gene type | protein-coding |
| Map location | 6p21.1-p12.1 |
| Pascal p-value | 0.623 |
| Fetal beta | -0.872 |
| DMG | 1 (# studies) |
Gene in Data Sources
| Gene set name | Method of gene set | Description | Info |
|---|---|---|---|
| CV:PGCnp | Genome-wide Association Study | GWAS | |
| DMG:Wockner_2014 | Genome-wide DNA methylation analysis | This dataset includes 4641 differentially methylated probes corresponding to 2929 unique genes between schizophrenia patients (n=24) and controls (n=24). | 1 |
| GSMA_I | Genome scan meta-analysis | Psr: 0.033 | |
| GSMA_IIE | Genome scan meta-analysis (European-ancestry samples) | Psr: 0.04433 |
Section I. Genetics and epigenetics annotation
 Differentially methylated gene
| Probe | Chromosome | Position | Nearest gene | P (dis) | Beta (dis) | FDR (dis) | Study |
|---|---|---|---|---|---|---|---|
| cg13256491 | 6 | 42231123 | TRERF1 | 4.089E-4 | 0.372 | 0.044 | DMG:Wockner_2014 |
Section II. Transcriptome annotation
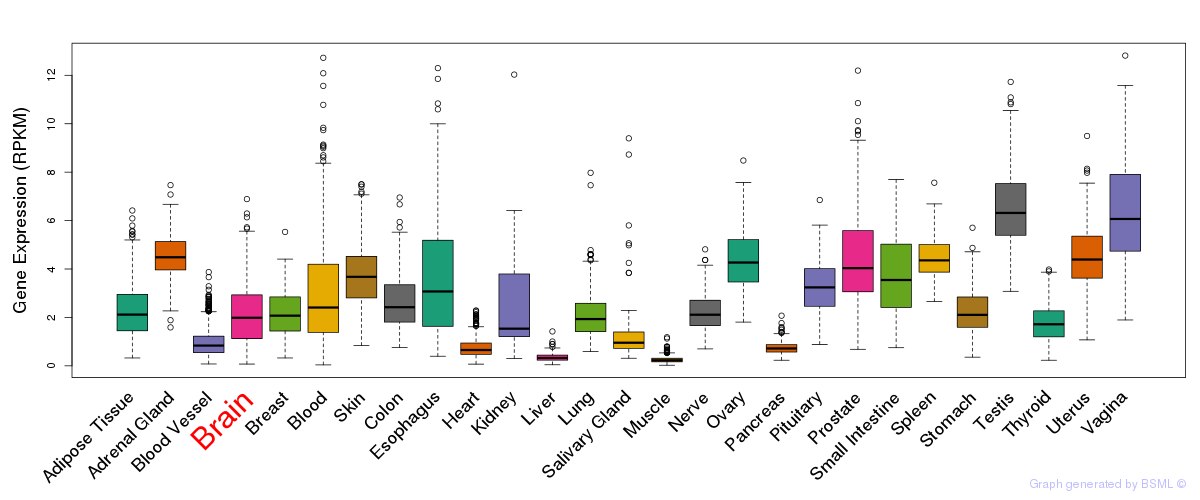
General gene expression (GTEx)
Gene expression during devlopment (BrainCloud)
Footnote:
A total of 269 time points ploted, with n=38 fetal samples (x=1:38). Each triangle represents one time point.
Gene expression of temporal and spatial changes (BrainSpan)
Footnote:
SC: sub-cortical regions; SM: sensory-motor regions; FC: frontal cortex; and TP: temporal-parietal cortex
ST1: fetal (13 - 26 postconception weeks), ST2: early infancy to late childhood (4 months to 11 years), and ST3: adolescence to adulthood (13 - 23 years)
The bar shown representes the lower 25% and upper 25% of the expression distribution.
Top co-expressed genes in brain regions
| Top 10 positively co-expressed genes | ||
| Gene | Pearson's Correlation | Spearman's Correlation |
| SLC30A9 | 0.92 | 0.91 |
| RAB2A | 0.91 | 0.90 |
| USP33 | 0.91 | 0.91 |
| SHOC2 | 0.91 | 0.91 |
| ARMC1 | 0.91 | 0.92 |
| ATF2 | 0.91 | 0.90 |
| LRPPRC | 0.91 | 0.90 |
| SCAMP1 | 0.90 | 0.92 |
| UGCG | 0.90 | 0.89 |
| UBQLN1 | 0.90 | 0.89 |
| Top 10 negatively co-expressed genes | ||
| Gene | Pearson's Correlation | Spearman's Correlation |
| MT-CO2 | -0.76 | -0.73 |
| FXYD1 | -0.74 | -0.75 |
| AF347015.33 | -0.74 | -0.71 |
| MT-CYB | -0.74 | -0.71 |
| AF347015.8 | -0.73 | -0.72 |
| AF347015.31 | -0.72 | -0.70 |
| HIGD1B | -0.72 | -0.71 |
| AF347015.2 | -0.72 | -0.69 |
| AF347015.26 | -0.72 | -0.68 |
| AF347015.21 | -0.71 | -0.69 |
Section III. Gene Ontology annotation
| Molecular function | GO term | Evidence | Neuro keywords | PubMed ID |
|---|---|---|---|---|
| GO:0003700 | transcription factor activity | IDA | 11349124 | |
| GO:0008270 | zinc ion binding | IEA | - | |
| GO:0008301 | DNA bending activity | NAS | 11349124 | |
| GO:0008134 | transcription factor binding | IPI | 11349124 | |
| GO:0016455 | RNA polymerase II transcription mediator activity | NAS | 11349124 | |
| GO:0030374 | ligand-dependent nuclear receptor transcription coactivator activity | NAS | 11349124 | |
| GO:0046872 | metal ion binding | IEA | - | |
| Biological process | GO term | Evidence | Neuro keywords | PubMed ID |
| GO:0006350 | transcription | IEA | - | |
| GO:0006707 | cholesterol catabolic process | NAS | 11349124 | |
| GO:0006694 | steroid biosynthetic process | NAS | 11349124 | |
| GO:0007275 | multicellular organismal development | NAS | 11349124 | |
| GO:0042592 | homeostatic process | NAS | 11349124 | |
| GO:0045893 | positive regulation of transcription, DNA-dependent | IDA | 11349124 | |
| GO:0046885 | regulation of hormone biosynthetic process | NAS | 11349124 | |
| Cellular component | GO term | Evidence | Neuro keywords | PubMed ID |
| GO:0005622 | intracellular | IEA | - | |
| GO:0005634 | nucleus | IDA | 11349124 |
Section V. Pathway annotation
| Pathway name | Pathway size | # SZGR 2.0 genes in pathway | Info |
|---|---|---|---|
| NUYTTEN NIPP1 TARGETS DN | 848 | 527 | All SZGR 2.0 genes in this pathway |
| HAN SATB1 TARGETS UP | 395 | 249 | All SZGR 2.0 genes in this pathway |
| CHEN METABOLIC SYNDROM NETWORK | 1210 | 725 | All SZGR 2.0 genes in this pathway |
| QI HYPOXIA | 140 | 96 | All SZGR 2.0 genes in this pathway |
| CHYLA CBFA2T3 TARGETS UP | 387 | 225 | All SZGR 2.0 genes in this pathway |
| JOHNSTONE PARVB TARGETS 2 DN | 336 | 211 | All SZGR 2.0 genes in this pathway |
| ZWANG TRANSIENTLY UP BY 1ST EGF PULSE ONLY | 1839 | 928 | All SZGR 2.0 genes in this pathway |
| ZWANG EGF INTERVAL DN | 214 | 124 | All SZGR 2.0 genes in this pathway |
Section VI. microRNA annotation
| miRNA family | Target position | miRNA ID | miRNA seq | ||
|---|---|---|---|---|---|
| UTR start | UTR end | Match method | |||
| miR-196 | 97 | 103 | m8 | hsa-miR-196a | UAGGUAGUUUCAUGUUGUUGG |
| hsa-miR-196b | UAGGUAGUUUCCUGUUGUUGG | ||||
- SZ: miRNAs which differentially expressed in brain cortex of schizophrenia patients comparing with control samples using microarray. Click here to see the list of SZ related miRNAs.
- Brain: miRNAs which are expressed in brain based on miRNA microarray expression studies. Click here to see the list of brain related miRNAs.