Gene Page: WIZ
Summary ?
| GeneID | 58525 |
| Symbol | WIZ |
| Synonyms | ZNF803 |
| Description | widely interspaced zinc finger motifs |
| Reference | HGNC:HGNC:30917|Ensembl:ENSG00000011451|Vega:OTTHUMG00000182448 |
| Gene type | protein-coding |
| Map location | 19p13.1 |
| Pascal p-value | 0.997 |
| TADA p-value | 0.017 |
| Fetal beta | 1.288 |
| eGene | Meta |
| Support | CompositeSet |
Gene in Data Sources
| Gene set name | Method of gene set | Description | Info |
|---|---|---|---|
| DMG:Wockner_2014 | Genome-wide DNA methylation analysis | This dataset includes 4641 differentially methylated probes corresponding to 2929 unique genes between schizophrenia patients (n=24) and controls (n=24). | 1 |
| DNM:Fromer_2014 | Whole Exome Sequencing analysis | This study reported a WES study of 623 schizophrenia trios, reporting DNMs using genomic DNA. | |
| PMID:cooccur | High-throughput literature-search | Systematic search in PubMed for genes co-occurring with SCZ keywords. A total of 3027 genes were included. | |
| Literature | High-throughput literature-search | Co-occurance with Schizophrenia keywords: schizophrenia,schizophrenias | Click to show details |
Section I. Genetics and epigenetics annotation
 DNM table
| Gene | Chromosome | Position | Ref | Alt | Transcript | AA change | Mutation type | Sift | CG46 | Trait | Study |
|---|---|---|---|---|---|---|---|---|---|---|---|
| WIZ | chr19 | 15536517 | G | A | NM_021241 | p.382R>C | missense | Schizophrenia | DNM:Fromer_2014 |
Differentially methylated gene
| Probe | Chromosome | Position | Nearest gene | P (dis) | Beta (dis) | FDR (dis) | Study |
|---|---|---|---|---|---|---|---|
| cg21216828 | 19 | 15560076 | MIR1470;WIZ | 2.35E-5 | -0.291 | 0.017 | DMG:Wockner_2014 |
Section II. Transcriptome annotation
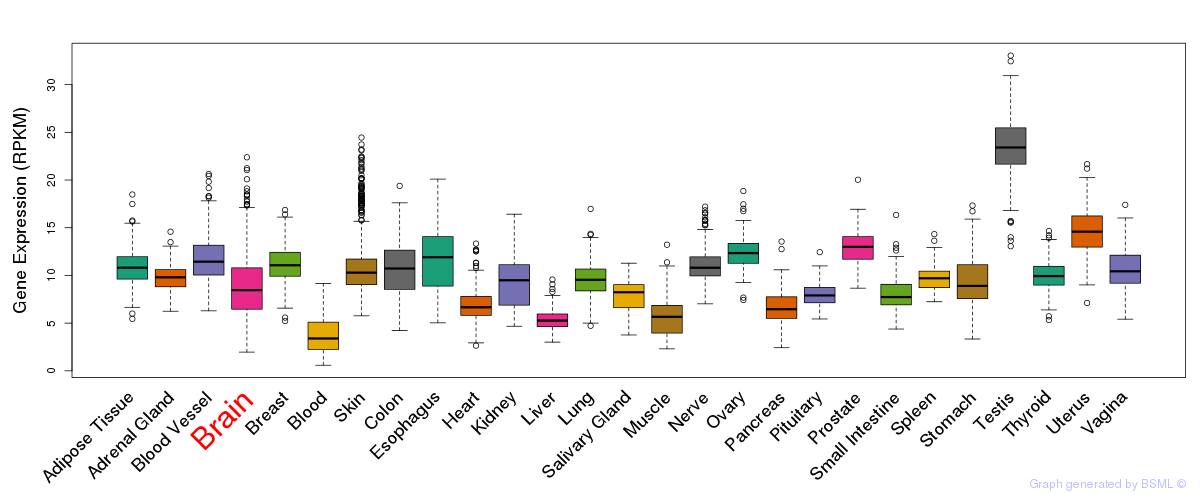
General gene expression (GTEx)
Gene expression during devlopment (BrainCloud)
Footnote:
A total of 269 time points ploted, with n=38 fetal samples (x=1:38). Each triangle represents one time point.
Gene expression of temporal and spatial changes (BrainSpan)
Footnote:
SC: sub-cortical regions; SM: sensory-motor regions; FC: frontal cortex; and TP: temporal-parietal cortex
ST1: fetal (13 - 26 postconception weeks), ST2: early infancy to late childhood (4 months to 11 years), and ST3: adolescence to adulthood (13 - 23 years)
The bar shown representes the lower 25% and upper 25% of the expression distribution.
Top co-expressed genes in brain regions
| Top 10 positively co-expressed genes | ||
| Gene | Pearson's Correlation | Spearman's Correlation |
| ADRM1 | 0.91 | 0.88 |
| C11orf68 | 0.91 | 0.90 |
| ZBTB45 | 0.89 | 0.90 |
| MRPS2 | 0.89 | 0.84 |
| IMP3 | 0.88 | 0.85 |
| ALKBH4 | 0.88 | 0.86 |
| TRAP1 | 0.88 | 0.83 |
| RNF126 | 0.88 | 0.87 |
| APBB1 | 0.88 | 0.87 |
| PPP2R1A | 0.88 | 0.85 |
| Top 10 negatively co-expressed genes | ||
| Gene | Pearson's Correlation | Spearman's Correlation |
| AF347015.8 | -0.72 | -0.67 |
| MT-CO2 | -0.71 | -0.64 |
| AF347015.33 | -0.69 | -0.65 |
| AF347015.21 | -0.69 | -0.66 |
| AF347015.27 | -0.69 | -0.67 |
| AF347015.31 | -0.68 | -0.63 |
| AF347015.26 | -0.68 | -0.66 |
| MT-CYB | -0.67 | -0.64 |
| NOSTRIN | -0.67 | -0.67 |
| AF347015.2 | -0.66 | -0.62 |
Section V. Pathway annotation
| Pathway name | Pathway size | # SZGR 2.0 genes in pathway | Info |
|---|---|---|---|
| GAZDA DIAMOND BLACKFAN ANEMIA ERYTHROID DN | 493 | 298 | All SZGR 2.0 genes in this pathway |
| PUJANA ATM PCC NETWORK | 1442 | 892 | All SZGR 2.0 genes in this pathway |
| BONOME OVARIAN CANCER SURVIVAL SUBOPTIMAL DEBULKING | 510 | 309 | All SZGR 2.0 genes in this pathway |
| ROME INSULIN TARGETS IN MUSCLE DN | 204 | 114 | All SZGR 2.0 genes in this pathway |
| BROWNE HCMV INFECTION 1HR UP | 61 | 44 | All SZGR 2.0 genes in this pathway |
| DELACROIX RAR BOUND ES | 462 | 273 | All SZGR 2.0 genes in this pathway |
| PHONG TNF RESPONSE VIA P38 COMPLETE | 227 | 151 | All SZGR 2.0 genes in this pathway |
| ACEVEDO FGFR1 TARGETS IN PROSTATE CANCER MODEL UP | 289 | 184 | All SZGR 2.0 genes in this pathway |