Gene Page: NPS
Summary ?
| GeneID | 594857 |
| Symbol | NPS |
| Synonyms | - |
| Description | neuropeptide S |
| Reference | MIM:609513|HGNC:HGNC:33940|Ensembl:ENSG00000214285|Vega:OTTHUMG00000188145 |
| Gene type | protein-coding |
| Map location | 10q26.2 |
| Pascal p-value | 0.341 |
Gene in Data Sources
| Gene set name | Method of gene set | Description | Info |
|---|---|---|---|
| CV:PGCnp | Genome-wide Association Study | GWAS | |
| PMID:cooccur | High-throughput literature-search | Systematic search in PubMed for genes co-occurring with SCZ keywords. A total of 3027 genes were included. | |
| GSMA_IIA | Genome scan meta-analysis (All samples) | Psr: 0.03487 | |
| Literature | High-throughput literature-search | Co-occurance with Schizophrenia keywords: schizophrenia,schizophrenic,schizophrenics,schizophrenias | Click to show details |
| GO_Annotation | Mapping neuro-related keywords to Gene Ontology annotations | Hits with neuro-related keywords: 1 |
Section I. Genetics and epigenetics annotation
Section II. Transcriptome annotation
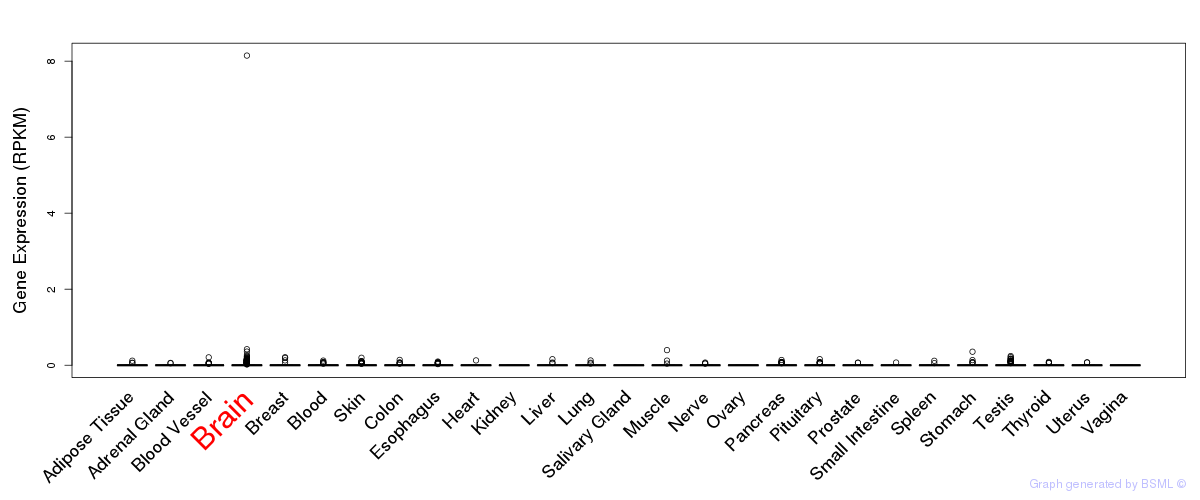
General gene expression (GTEx)
Gene expression during devlopment (BrainCloud)
Footnote:
A total of 269 time points ploted, with n=38 fetal samples (x=1:38). Each triangle represents one time point.
Gene expression of temporal and spatial changes (BrainSpan)
Footnote:
SC: sub-cortical regions; SM: sensory-motor regions; FC: frontal cortex; and TP: temporal-parietal cortex
ST1: fetal (13 - 26 postconception weeks), ST2: early infancy to late childhood (4 months to 11 years), and ST3: adolescence to adulthood (13 - 23 years)
The bar shown representes the lower 25% and upper 25% of the expression distribution.
No co-expressed genes in brain regions
Section III. Gene Ontology annotation
| Biological process | GO term | Evidence | Neuro keywords | PubMed ID |
|---|---|---|---|---|
| GO:0007218 | neuropeptide signaling pathway | IEA | Neurotransmitter (GO term level: 8) | - |
| Cellular component | GO term | Evidence | Neuro keywords | PubMed ID |
| GO:0005576 | extracellular region | IEA | - |
Section V. Pathway annotation
| Pathway name | Pathway size | # SZGR 2.0 genes in pathway | Info |
|---|---|---|---|
| REACTOME GASTRIN CREB SIGNALLING PATHWAY VIA PKC AND MAPK | 205 | 136 | All SZGR 2.0 genes in this pathway |
| REACTOME SIGNALING BY GPCR | 920 | 449 | All SZGR 2.0 genes in this pathway |
| REACTOME PEPTIDE LIGAND BINDING RECEPTORS | 188 | 108 | All SZGR 2.0 genes in this pathway |
| REACTOME CLASS A1 RHODOPSIN LIKE RECEPTORS | 305 | 177 | All SZGR 2.0 genes in this pathway |
| REACTOME G ALPHA Q SIGNALLING EVENTS | 184 | 116 | All SZGR 2.0 genes in this pathway |
| REACTOME GPCR DOWNSTREAM SIGNALING | 805 | 368 | All SZGR 2.0 genes in this pathway |
| REACTOME G ALPHA S SIGNALLING EVENTS | 121 | 82 | All SZGR 2.0 genes in this pathway |
| REACTOME GPCR LIGAND BINDING | 408 | 246 | All SZGR 2.0 genes in this pathway |
Section VI. microRNA annotation
| miRNA family | Target position | miRNA ID | miRNA seq | ||
|---|---|---|---|---|---|
| UTR start | UTR end | Match method | |||
| miR-363 | 7 | 13 | 1A | hsa-miR-363 | AUUGCACGGUAUCCAUCUGUAA |
- SZ: miRNAs which differentially expressed in brain cortex of schizophrenia patients comparing with control samples using microarray. Click here to see the list of SZ related miRNAs.
- Brain: miRNAs which are expressed in brain based on miRNA microarray expression studies. Click here to see the list of brain related miRNAs.