Gene Page: SBF1
Summary ?
| GeneID | 6305 |
| Symbol | SBF1 |
| Synonyms | CMT4B3|DENND7A|MTMR5 |
| Description | SET binding factor 1 |
| Reference | MIM:603560|HGNC:HGNC:10542|Ensembl:ENSG00000100241|HPRD:06788|Vega:OTTHUMG00000150204 |
| Gene type | protein-coding |
| Map location | 22q13.33 |
| Pascal p-value | 0.036 |
| Sherlock p-value | 0.065 |
| Fetal beta | -0.933 |
| DMG | 1 (# studies) |
| Support | G2Cdb.human_BAYES-COLLINS-HUMAN-PSD-CONSENSUS G2Cdb.human_BAYES-COLLINS-HUMAN-PSD-FULL G2Cdb.human_BAYES-COLLINS-MOUSE-PSD-CONSENSUS CompositeSet Darnell FMRP targets Ascano FMRP targets |
Gene in Data Sources
| Gene set name | Method of gene set | Description | Info |
|---|---|---|---|
| CV:PGCnp | Genome-wide Association Study | GWAS | |
| DMG:Wockner_2014 | Genome-wide DNA methylation analysis | This dataset includes 4641 differentially methylated probes corresponding to 2929 unique genes between schizophrenia patients (n=24) and controls (n=24). | 1 |
Section I. Genetics and epigenetics annotation
 Differentially methylated gene
| Probe | Chromosome | Position | Nearest gene | P (dis) | Beta (dis) | FDR (dis) | Study |
|---|---|---|---|---|---|---|---|
| cg27544191 | 22 | 50913719 | SBF1 | 3.34E-4 | -0.415 | 0.041 | DMG:Wockner_2014 |
Section II. Transcriptome annotation
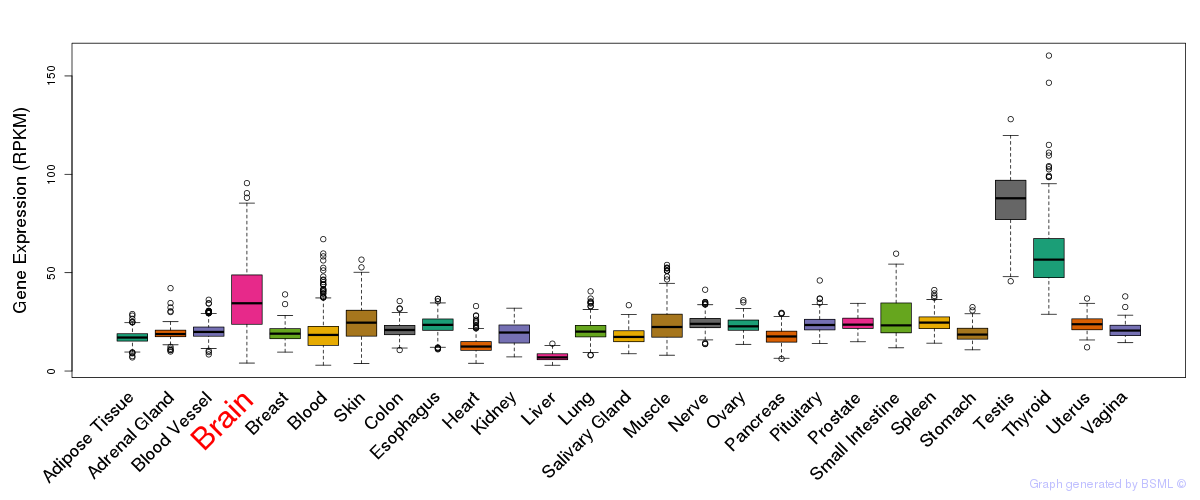
General gene expression (GTEx)
Gene expression during devlopment (BrainCloud)
Footnote:
A total of 269 time points ploted, with n=38 fetal samples (x=1:38). Each triangle represents one time point.
Gene expression of temporal and spatial changes (BrainSpan)
Footnote:
SC: sub-cortical regions; SM: sensory-motor regions; FC: frontal cortex; and TP: temporal-parietal cortex
ST1: fetal (13 - 26 postconception weeks), ST2: early infancy to late childhood (4 months to 11 years), and ST3: adolescence to adulthood (13 - 23 years)
The bar shown representes the lower 25% and upper 25% of the expression distribution.
Top co-expressed genes in brain regions
| Top 10 positively co-expressed genes | ||
| Gene | Pearson's Correlation | Spearman's Correlation |
| SLA | 0.82 | 0.75 |
| AP000926.2 | 0.82 | 0.72 |
| POU3F2 | 0.80 | 0.71 |
| MEX3B | 0.80 | 0.73 |
| CSRP2 | 0.79 | 0.63 |
| ZNF167 | 0.79 | 0.74 |
| MLLT3 | 0.78 | 0.75 |
| PGBD2 | 0.78 | 0.71 |
| TTC28 | 0.78 | 0.76 |
| ZSCAN2 | 0.78 | 0.74 |
| Top 10 negatively co-expressed genes | ||
| Gene | Pearson's Correlation | Spearman's Correlation |
| AIFM3 | -0.56 | -0.65 |
| C5orf53 | -0.56 | -0.63 |
| LHPP | -0.55 | -0.57 |
| HLA-F | -0.55 | -0.62 |
| LDHD | -0.55 | -0.59 |
| FBXO2 | -0.55 | -0.59 |
| PTH1R | -0.55 | -0.62 |
| ALDOC | -0.55 | -0.58 |
| TSC22D4 | -0.55 | -0.65 |
| ACOT13 | -0.54 | -0.59 |
Section V. Pathway annotation
| Pathway name | Pathway size | # SZGR 2.0 genes in pathway | Info |
|---|---|---|---|
| HOLLMANN APOPTOSIS VIA CD40 UP | 201 | 125 | All SZGR 2.0 genes in this pathway |
| PENG GLUCOSE DEPRIVATION UP | 48 | 26 | All SZGR 2.0 genes in this pathway |
| WONG IFNA2 RESISTANCE DN | 34 | 20 | All SZGR 2.0 genes in this pathway |
| ASTIER INTEGRIN SIGNALING | 59 | 44 | All SZGR 2.0 genes in this pathway |
| DEBIASI APOPTOSIS BY REOVIRUS INFECTION DN | 287 | 208 | All SZGR 2.0 genes in this pathway |
| HELLER HDAC TARGETS UP | 317 | 208 | All SZGR 2.0 genes in this pathway |
| ACEVEDO LIVER TUMOR VS NORMAL ADJACENT TISSUE UP | 863 | 514 | All SZGR 2.0 genes in this pathway |
| BONOME OVARIAN CANCER SURVIVAL SUBOPTIMAL DEBULKING | 510 | 309 | All SZGR 2.0 genes in this pathway |
| MATZUK MALE REPRODUCTION SERTOLI | 28 | 23 | All SZGR 2.0 genes in this pathway |
| HAN SATB1 TARGETS DN | 442 | 275 | All SZGR 2.0 genes in this pathway |
| MILI PSEUDOPODIA HAPTOTAXIS DN | 668 | 419 | All SZGR 2.0 genes in this pathway |
| BROWNE HCMV INFECTION 1HR DN | 222 | 147 | All SZGR 2.0 genes in this pathway |
| BROWNE HCMV INFECTION 4HR DN | 254 | 158 | All SZGR 2.0 genes in this pathway |
| KASLER HDAC7 TARGETS 1 UP | 194 | 133 | All SZGR 2.0 genes in this pathway |