Gene Page: NARFL
Summary ?
| GeneID | 64428 |
| Symbol | NARFL |
| Synonyms | HPRN|IOP1|LET1L|PRN |
| Description | nuclear prelamin A recognition factor-like |
| Reference | MIM:611118|HGNC:HGNC:14179|Ensembl:ENSG00000103245|HPRD:14810|Vega:OTTHUMG00000122093 |
| Gene type | protein-coding |
| Map location | 16p13.3 |
| Pascal p-value | 0.072 |
| Sherlock p-value | 0.72 |
| Fetal beta | -0.124 |
| DMG | 2 (# studies) |
| eGene | Caudate basal ganglia Cerebellar Hemisphere Cerebellum Cortex Frontal Cortex BA9 Nucleus accumbens basal ganglia Myers' cis & trans |
Gene in Data Sources
| Gene set name | Method of gene set | Description | Info |
|---|---|---|---|
| CV:PGCnp | Genome-wide Association Study | GWAS | |
| DMG:Nishioka_2013 | Genome-wide DNA methylation analysis | The authors investigated the methylation profiles of DNA in peripheral blood cells from 18 patients with first-episode schizophrenia (FESZ) and from 15 normal controls. | 2 |
| DMG:Wockner_2014 | Genome-wide DNA methylation analysis | This dataset includes 4641 differentially methylated probes corresponding to 2929 unique genes between schizophrenia patients (n=24) and controls (n=24). | 2 |
Section I. Genetics and epigenetics annotation
 Differentially methylated gene
| Probe | Chromosome | Position | Nearest gene | P (dis) | Beta (dis) | FDR (dis) | Study |
|---|---|---|---|---|---|---|---|
| cg27209265 | 16 | 790912 | NARFL | 2.117E-4 | -0.193 | 0.036 | DMG:Wockner_2014 |
| cg14711016 | 16 | 790766 | NARFL | -0.02 | 0.44 | DMG:Nishioka_2013 |
eQTL annotation
| SNP ID | Chromosome | Position | eGene | Gene Entrez ID | pvalue | qvalue | TSS distance | eQTL type |
|---|---|---|---|---|---|---|---|---|
| rs2108091 | chr7 | 16975023 | NARFL | 64428 | 0.12 | trans | ||
| rs791607 | chr7 | 127872834 | NARFL | 64428 | 0.19 | trans | ||
| rs2122627 | chr7 | 127883322 | NARFL | 64428 | 0.18 | trans |
Section II. Transcriptome annotation
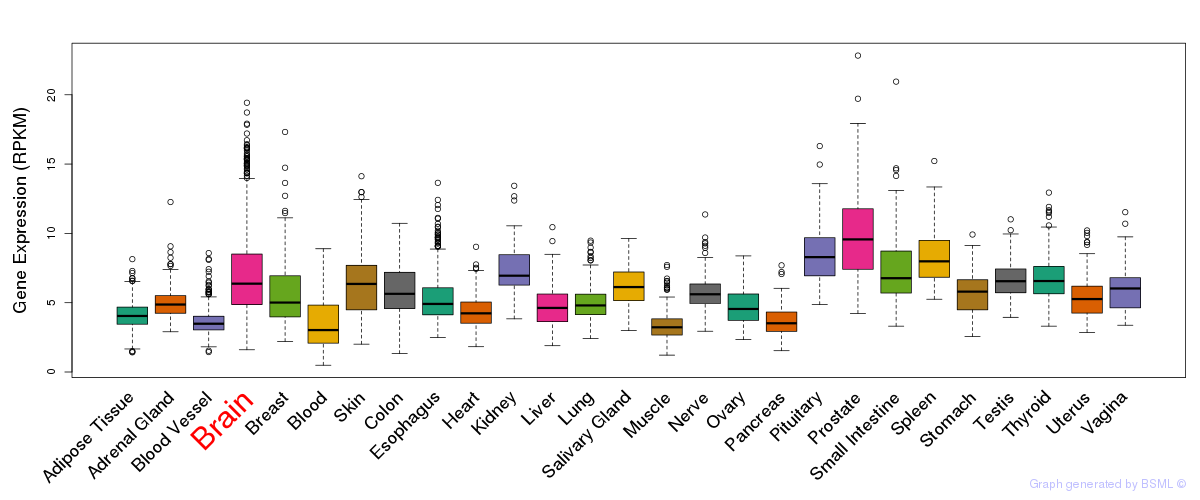
General gene expression (GTEx)
Gene expression during devlopment (BrainCloud)
Footnote:
A total of 269 time points ploted, with n=38 fetal samples (x=1:38). Each triangle represents one time point.
Gene expression of temporal and spatial changes (BrainSpan)
Footnote:
SC: sub-cortical regions; SM: sensory-motor regions; FC: frontal cortex; and TP: temporal-parietal cortex
ST1: fetal (13 - 26 postconception weeks), ST2: early infancy to late childhood (4 months to 11 years), and ST3: adolescence to adulthood (13 - 23 years)
The bar shown representes the lower 25% and upper 25% of the expression distribution.
No co-expressed genes in brain regions
Section V. Pathway annotation
| Pathway name | Pathway size | # SZGR 2.0 genes in pathway | Info |
|---|---|---|---|
| NIKOLSKY BREAST CANCER 16P13 AMPLICON | 120 | 49 | All SZGR 2.0 genes in this pathway |
| ROSS ACUTE MYELOID LEUKEMIA CBF | 82 | 57 | All SZGR 2.0 genes in this pathway |
| ROSS AML WITH AML1 ETO FUSION | 76 | 55 | All SZGR 2.0 genes in this pathway |
| VERHAAK AML WITH NPM1 MUTATED DN | 246 | 180 | All SZGR 2.0 genes in this pathway |
| VALK AML CLUSTER 13 | 30 | 20 | All SZGR 2.0 genes in this pathway |
| ZWANG TRANSIENTLY UP BY 1ST EGF PULSE ONLY | 1839 | 928 | All SZGR 2.0 genes in this pathway |