Gene Page: TFR2
Summary ?
| GeneID | 7036 |
| Symbol | TFR2 |
| Synonyms | HFE3|TFRC2 |
| Description | transferrin receptor 2 |
| Reference | MIM:604720|HGNC:HGNC:11762|Ensembl:ENSG00000106327|HPRD:05282|Vega:OTTHUMG00000159598 |
| Gene type | protein-coding |
| Map location | 7q22 |
| Pascal p-value | 0.004 |
| Fetal beta | -0.914 |
| DMG | 1 (# studies) |
Gene in Data Sources
| Gene set name | Method of gene set | Description | Info |
|---|---|---|---|
| CV:PGCnp | Genome-wide Association Study | GWAS | |
| DMG:Wockner_2014 | Genome-wide DNA methylation analysis | This dataset includes 4641 differentially methylated probes corresponding to 2929 unique genes between schizophrenia patients (n=24) and controls (n=24). | 1 |
Section I. Genetics and epigenetics annotation
 Differentially methylated gene
| Probe | Chromosome | Position | Nearest gene | P (dis) | Beta (dis) | FDR (dis) | Study |
|---|---|---|---|---|---|---|---|
| cg19767562 | 7 | 100224437 | TFR2 | 8.85E-5 | -0.428 | 0.027 | DMG:Wockner_2014 |
Section II. Transcriptome annotation
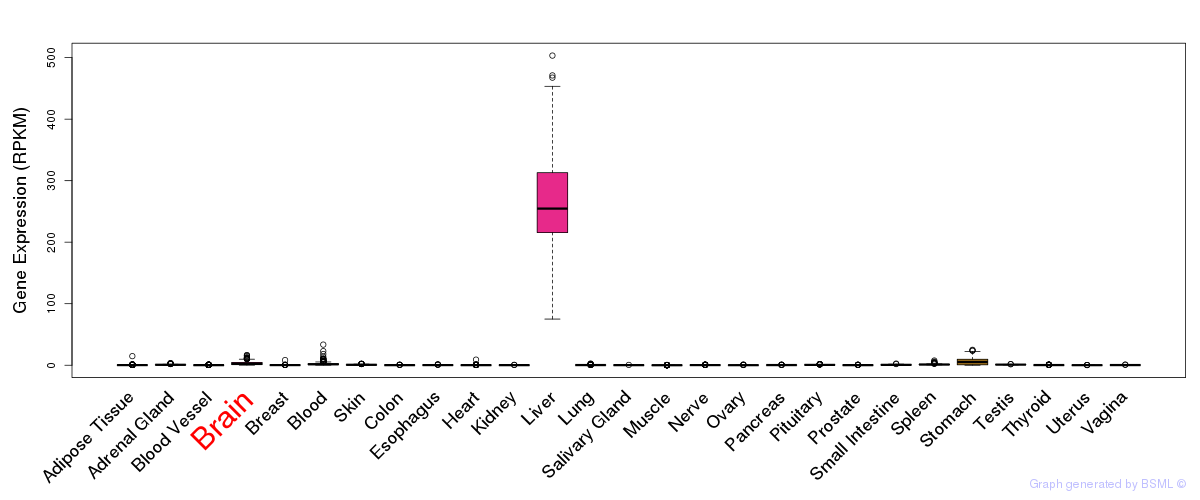
General gene expression (GTEx)
Gene expression during devlopment (BrainCloud)
Footnote:
A total of 269 time points ploted, with n=38 fetal samples (x=1:38). Each triangle represents one time point.
Gene expression of temporal and spatial changes (BrainSpan)
Footnote:
SC: sub-cortical regions; SM: sensory-motor regions; FC: frontal cortex; and TP: temporal-parietal cortex
ST1: fetal (13 - 26 postconception weeks), ST2: early infancy to late childhood (4 months to 11 years), and ST3: adolescence to adulthood (13 - 23 years)
The bar shown representes the lower 25% and upper 25% of the expression distribution.
Top co-expressed genes in brain regions
| Top 10 positively co-expressed genes | ||
| Gene | Pearson's Correlation | Spearman's Correlation |
| RARRES3 | 0.74 | 0.71 |
| BBOX1 | 0.73 | 0.72 |
| RHOC | 0.73 | 0.66 |
| PXMP3 | 0.72 | 0.63 |
| PTPMT1 | 0.71 | 0.68 |
| SRI | 0.71 | 0.62 |
| CD63 | 0.70 | 0.67 |
| MTHFS | 0.70 | 0.71 |
| S100A6 | 0.70 | 0.76 |
| C5orf35 | 0.69 | 0.65 |
| Top 10 negatively co-expressed genes | ||
| Gene | Pearson's Correlation | Spearman's Correlation |
| UPF2 | -0.51 | -0.59 |
| ZC3H13 | -0.49 | -0.55 |
| RTF1 | -0.48 | -0.58 |
| TNKS1BP1 | -0.48 | -0.53 |
| BAZ1B | -0.47 | -0.56 |
| SUPT6H | -0.47 | -0.52 |
| TCOF1 | -0.47 | -0.52 |
| EIF3A | -0.47 | -0.57 |
| GIGYF2 | -0.47 | -0.54 |
| DDX46 | -0.47 | -0.58 |
Section V. Pathway annotation
| Pathway name | Pathway size | # SZGR 2.0 genes in pathway | Info |
|---|---|---|---|
| CASORELLI ACUTE PROMYELOCYTIC LEUKEMIA DN | 663 | 425 | All SZGR 2.0 genes in this pathway |
| DIAZ CHRONIC MEYLOGENOUS LEUKEMIA UP | 1382 | 904 | All SZGR 2.0 genes in this pathway |
| TAKEDA TARGETS OF NUP98 HOXA9 FUSION 16D UP | 175 | 108 | All SZGR 2.0 genes in this pathway |
| HOEBEKE LYMPHOID STEM CELL DN | 86 | 59 | All SZGR 2.0 genes in this pathway |
| TONKS TARGETS OF RUNX1 RUNX1T1 FUSION HSC DN | 187 | 115 | All SZGR 2.0 genes in this pathway |
| GRAHAM CML QUIESCENT VS NORMAL QUIESCENT UP | 87 | 45 | All SZGR 2.0 genes in this pathway |
| GRAHAM CML DIVIDING VS NORMAL QUIESCENT UP | 181 | 101 | All SZGR 2.0 genes in this pathway |
| ROSS AML OF FAB M7 TYPE | 68 | 44 | All SZGR 2.0 genes in this pathway |
| SANSOM APC TARGETS DN | 366 | 238 | All SZGR 2.0 genes in this pathway |
| KANG IMMORTALIZED BY TERT DN | 102 | 67 | All SZGR 2.0 genes in this pathway |
| SU LIVER | 55 | 32 | All SZGR 2.0 genes in this pathway |
| CHIANG LIVER CANCER SUBCLASS PROLIFERATION DN | 179 | 97 | All SZGR 2.0 genes in this pathway |
| CAIRO HEPATOBLASTOMA DN | 267 | 160 | All SZGR 2.0 genes in this pathway |
| CAIRO LIVER DEVELOPMENT DN | 222 | 141 | All SZGR 2.0 genes in this pathway |
| BROWNE HCMV INFECTION 1HR DN | 222 | 147 | All SZGR 2.0 genes in this pathway |
| OHGUCHI LIVER HNF4A TARGETS DN | 149 | 85 | All SZGR 2.0 genes in this pathway |
| CHYLA CBFA2T3 TARGETS DN | 242 | 146 | All SZGR 2.0 genes in this pathway |
| BRUINS UVC RESPONSE VIA TP53 GROUP A | 898 | 516 | All SZGR 2.0 genes in this pathway |