Gene Page: ARMC7
Summary ?
| GeneID | 79637 |
| Symbol | ARMC7 |
| Synonyms | - |
| Description | armadillo repeat containing 7 |
| Reference | HGNC:HGNC:26168|Ensembl:ENSG00000125449|HPRD:08649|Vega:OTTHUMG00000179345 |
| Gene type | protein-coding |
| Map location | 17q25.1 |
| Pascal p-value | 0.057 |
| Sherlock p-value | 0.804 |
| Fetal beta | -0.28 |
| DMG | 1 (# studies) |
| eGene | Cerebellum Frontal Cortex BA9 Hippocampus Nucleus accumbens basal ganglia Myers' cis & trans |
Gene in Data Sources
| Gene set name | Method of gene set | Description | Info |
|---|---|---|---|
| CV:GWASdb | Genome-wide Association Studies | GWASdb records for schizophrenia | |
| CV:PGCnp | Genome-wide Association Study | GWAS | |
| DMG:vanEijk_2014 | Genome-wide DNA methylation analysis | This dataset includes 432 differentially methylated CpG sites corresponding to 391 unique transcripts between schizophrenia patients (n=260) and unaffected controls (n=250). | 2 |
Section I. Genetics and epigenetics annotation
 Differentially methylated gene
| Probe | Chromosome | Position | Nearest gene | P (dis) | Beta (dis) | FDR (dis) | Study |
|---|---|---|---|---|---|---|---|
| cg26129916 | 17 | 73258208 | ARMC7 | 4.789E-4 | 3.166 | DMG:vanEijk_2014 | |
| cg23727583 | 17 | 72869061 | ARMC7 | 1.343E-4 | 2.619 | DMG:vanEijk_2014 |
eQTL annotation
| SNP ID | Chromosome | Position | eGene | Gene Entrez ID | pvalue | qvalue | TSS distance | eQTL type |
|---|---|---|---|---|---|---|---|---|
| rs16829545 | chr2 | 151977407 | ARMC7 | 79637 | 7.387E-4 | trans | ||
| rs3845734 | chr2 | 171125572 | ARMC7 | 79637 | 0 | trans | ||
| rs7584986 | chr2 | 184111432 | ARMC7 | 79637 | 0.1 | trans | ||
| rs2183142 | chr4 | 159232695 | ARMC7 | 79637 | 0.06 | trans | ||
| rs17762315 | chr5 | 76807576 | ARMC7 | 79637 | 7.797E-4 | trans | ||
| rs7787830 | chr7 | 98797019 | ARMC7 | 79637 | 0.06 | trans | ||
| rs16955618 | chr15 | 29937543 | ARMC7 | 79637 | 1.714E-4 | trans |
Section II. Transcriptome annotation
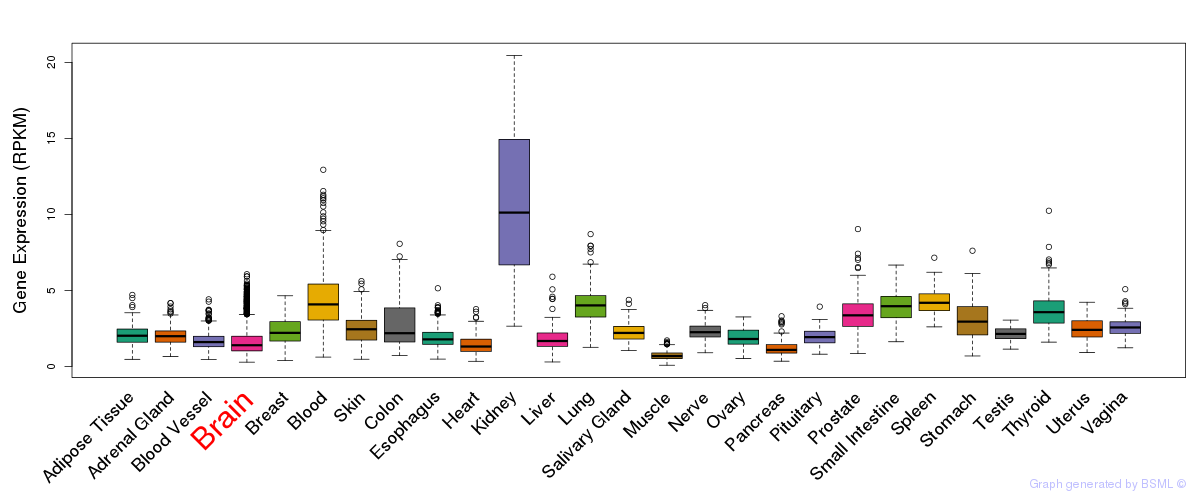
General gene expression (GTEx)
Gene expression during devlopment (BrainCloud)
Footnote:
A total of 269 time points ploted, with n=38 fetal samples (x=1:38). Each triangle represents one time point.
Gene expression of temporal and spatial changes (BrainSpan)
Footnote:
SC: sub-cortical regions; SM: sensory-motor regions; FC: frontal cortex; and TP: temporal-parietal cortex
ST1: fetal (13 - 26 postconception weeks), ST2: early infancy to late childhood (4 months to 11 years), and ST3: adolescence to adulthood (13 - 23 years)
The bar shown representes the lower 25% and upper 25% of the expression distribution.
Top co-expressed genes in brain regions
| Top 10 positively co-expressed genes | ||
| Gene | Pearson's Correlation | Spearman's Correlation |
| C1orf149 | 0.90 | 0.89 |
| CDK8 | 0.89 | 0.88 |
| C9orf30 | 0.89 | 0.89 |
| MRPL3 | 0.88 | 0.88 |
| ARMCX1 | 0.88 | 0.90 |
| DYNC1LI1 | 0.88 | 0.88 |
| DYM | 0.88 | 0.88 |
| RAB11A | 0.88 | 0.87 |
| TADA1L | 0.87 | 0.88 |
| BFAR | 0.87 | 0.87 |
| Top 10 negatively co-expressed genes | ||
| Gene | Pearson's Correlation | Spearman's Correlation |
| MT-CO2 | -0.76 | -0.81 |
| AF347015.33 | -0.75 | -0.81 |
| AF347015.8 | -0.75 | -0.82 |
| AF347015.27 | -0.75 | -0.81 |
| MT-CYB | -0.74 | -0.81 |
| AF347015.26 | -0.74 | -0.81 |
| AF347015.15 | -0.73 | -0.82 |
| AF347015.2 | -0.73 | -0.81 |
| AF347015.31 | -0.72 | -0.79 |
| HLA-F | -0.72 | -0.77 |
Section V. Pathway annotation
| Pathway name | Pathway size | # SZGR 2.0 genes in pathway | Info |
|---|---|---|---|
| GRAESSMANN APOPTOSIS BY SERUM DEPRIVATION UP | 552 | 347 | All SZGR 2.0 genes in this pathway |
| GRAESSMANN APOPTOSIS BY DOXORUBICIN UP | 1142 | 669 | All SZGR 2.0 genes in this pathway |
| GRAESSMANN RESPONSE TO MC AND DOXORUBICIN UP | 612 | 367 | All SZGR 2.0 genes in this pathway |
| LASTOWSKA NEUROBLASTOMA COPY NUMBER UP | 181 | 108 | All SZGR 2.0 genes in this pathway |
| NIKOLSKY BREAST CANCER 17Q21 Q25 AMPLICON | 335 | 181 | All SZGR 2.0 genes in this pathway |
| ACEVEDO LIVER CANCER UP | 973 | 570 | All SZGR 2.0 genes in this pathway |
| CHEN METABOLIC SYNDROM NETWORK | 1210 | 725 | All SZGR 2.0 genes in this pathway |
| BHAT ESR1 TARGETS NOT VIA AKT1 DN | 88 | 61 | All SZGR 2.0 genes in this pathway |
| ZWANG TRANSIENTLY UP BY 1ST EGF PULSE ONLY | 1839 | 928 | All SZGR 2.0 genes in this pathway |
| ZWANG EGF INTERVAL DN | 214 | 124 | All SZGR 2.0 genes in this pathway |